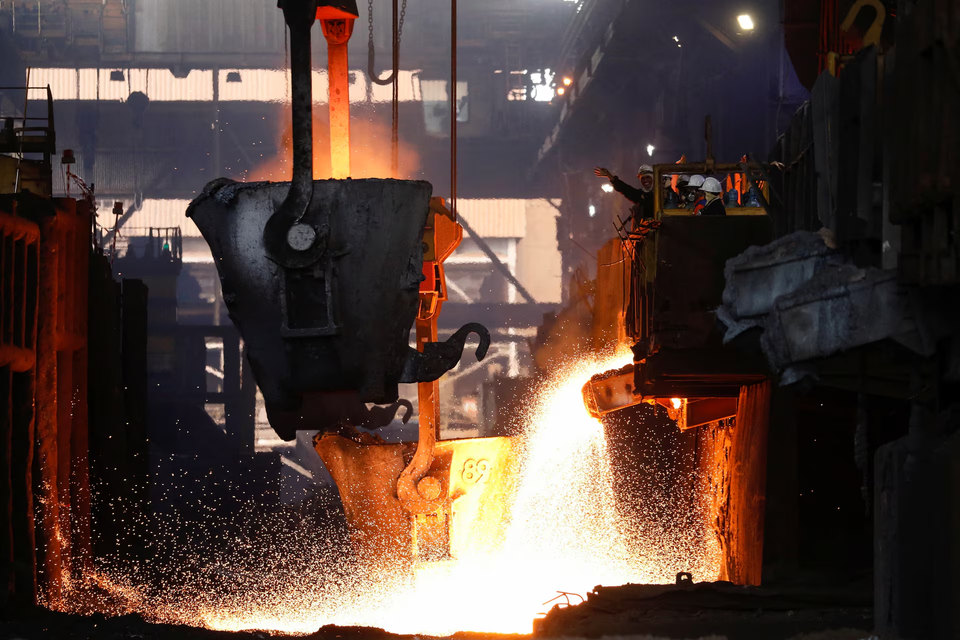
Turbines, tickets and tungsten
Siemens Energy, IGD, JCDecaux, Burberry, Bechtle, Stellantis, Acciona, Moderna, Rosenbauer, Allianz, RTL Group, Intershop, eDreams ODIGEO, AmRest, Soitec, Brenntag, MLP, Técnicas Reunidas, Ströer, Sonova, Merlin Properties, Dassault Systèmes, INDUS, Bastide, GEA, freenet, Richemont... and more

At Lux Opes, we break down companies into quick takes that get straight to the point - what is happening, why it matters, and what to watch next.
For the best reading experience, we recommend reading at Lux Opes
Financial KPIs
| Company | Price | Mkt cap | EV/ EBITDA* | P/E* | Upside |
|---|---|---|---|---|---|
| SIEMENS ENERGY | 128.32 | 109,072 | 11.1x | 19.9x | 47.6% |
| IGD | 4.51 | 497 | 13.3x | 12.2x | 6.2% |
| JCDECAUX | 27.30 | 5,846 | 9.7x | 18.7x | 6.6% |
| BURBERRY | 1173.50 | 4,270 | 9.1x | 30.6x | 7.1% |
| BECHTLE | 32.32 | 4,072 | 8.3x | 16.1x | 35.4% |
| STELLANTIS | 3.33 | 9,789 | 1.0x | 8.0x | 48.2% |
| ACCIONA | 201 | 11,026 | 7.3x | 18.8x | 6.2% |
| MODERNA | 215.27 | 87,103 | -29.1x | – | -22.8% |
| ROSENBAUER | 55.00 | 561 | 7.3x | 10.1x | 31.5% |
| ALLIANZ | 471.60 | 176,459 | – | 15.3x | -1.6% |
| RTL GROUP | 32.60 | 5,045 | 7.8x | 13.3x | -3.8% |
| INTERSHOP | 163.00 | 1,549 | 15.1x | 17.3x | 11.0% |
| EDREAMS ODIGEO | 4.71 | 530 | 6.4x | 14.1x | 34.8% |
| AMREST | 9.06 | 1,989 | 4.8x | 29.3x | -0.3% |
| SOITEC | 98.16 | 3,516 | 16.8x | 103.2x | 76.7% |
| BRENNTAG | 57.34 | 8,279 | 7.9x | 14.4x | 2.8% |
| MLP | 11.64 | 1,273 | -2.5x | 15.4x | 17.0% |
| TECNICAS REUNIDAS | 31.22 | 2,507 | 6.7x | 14.0x | 30.1% |
| STROER | 38.42 | 2,119 | 6.1x | 13.5x | 26.0% |
| SONOVA | 287.80 | 17,161 | 17.1x | 25.1x | -4.7% |
| MERLIN PROPERTIES | 11.58 | 7,180 | 24.8x | 21.4x | 44.8% |
| DASSAULT SYSTEMES | 25 | 34,222 | 14.3x | 18.7x | -0.3% |
| INDUS | 34.55 | 891 | 4.4x | 6.5x | 24.9% |
| BASTIDE | 19.40 | 145 | 3.5x | 8.8x | 39.2% |
| GEA GROUP | 68.90 | 11,217 | 11.2x | 20.8x | 6.1% |
| FREENET | 24.64 | 2,930 | 7.1x | 12.1x | 8.3% |
| RICHEMONT | 176.15 | 104,165 | 15.1x | 25.2x | 19.3% |
| ASTA ENERGY | 47.80 | 681 | 10.0x | 20.8x | 60.4% |
| DEUTSCHE PFANDBRIEF | 2.64 | 356 | 162.8x | 67.4x | 17.2% |
| GERARD PERRIER | 74.20 | 295 | 7.5x | 14.4x | 34.8% |
| SIXT SE | 72.45 | 3,163 | 5.2x | 10.3x | 29.6% |
| UNIPER SE | – | – | – | – | n.m. |
| ACS | 90.45 | 25,064 | 7.6x | 21.5x | 37.6% |
| MISTER SPEX | 0.90 | 32 | -6.5x | – | 202.8% |
| SECURITAS AB | 164.10 | 94,094 | 8.4x | 12.9x | 3.2% |
| MBB SE | 200 | 1,087 | 2.7x | 12.8x | 9.3% |
| CTS EVENTIM | 61.20 | 5,875 | 7.8x | 18.5x | 37.3% |
| IDI | 68.20 | 490 | -38.2x | 8.2x | 14.4% |
| JOST WERKE | 58.60 | 960 | 6.3x | 9.8x | 32.1% |
| STRABAG | 107.20 | 12,650 | 5.3x | 13.4x | 20.8% |
| ALLGEIER | 13.50 | 156 | 8.1x | 27.1x | 38.0% |
* Next fiscal year (FY+1). Upside = gap to the average 12-month analyst target. Local currency; market cap in millions. Source: Bloomberg, analyst consensus.
All financial KPIs41 companies · 50 data rows from BloombergShow
| Local currency | SIEMENS ENERGY | IGD | JCDECAUX | BURBERRY | BECHTLE | STELLANTIS | ACCIONA | MODERNA | ROSENBAUER | ALLIANZ | RTL GROUP | INTERSHOP | EDREAMS ODIGEO | AMREST | SOITEC | BRENNTAG | MLP | TECNICAS REUNIDAS | STROER | SONOVA | MERLIN PROPERTIES | DASSAULT SYSTEMES | INDUS | BASTIDE | GEA GROUP | FREENET | RICHEMONT | ASTA ENERGY | DEUTSCHE PFANDBRIEF | GERARD PERRIER | SIXT SE | UNIPER SE | ACS | MISTER SPEX | SECURITAS AB | MBB SE | CTS EVENTIM | IDI | JOST WERKE | STRABAG | ALLGEIER |
|---|---|---|---|---|---|---|---|---|---|---|---|---|---|---|---|---|---|---|---|---|---|---|---|---|---|---|---|---|---|---|---|---|---|---|---|---|---|---|---|---|---|
| Price and shares | |||||||||||||||||||||||||||||||||||||||||
| Latest fiscal year | 2026 A | 2025 A | 2025 A | 2026 A | 2025 A | 2025 A | 2025 A | 2025 A | 2025 A | 2025 A | 2025 A | 2025 A | 2026 A | 2025 A | 2026 A | 2025 A | 2025 A | 2025 A | 2025 A | 2026 A | 2025 A | 2025 A | 2025 A | 2026 A | 2025 A | 2025 A | 2026 A | 2025 A | 2025 A | 2025 A | 2025 A | 2025 A | 2025 A | 2025 A | 2025 A | 2025 A | 2025 A | 2025 A | 2025 A | 2025 A | 2025 A |
| Latest period end | 30/09 | 30/09 | 30/06 | 26/09 | 30/09 | 30/09 | 30/06 | 30/09 | 30/09 | 30/09 | 30/06 | 30/06 | 30/09 | 30/09 | 31/03 | 30/09 | 30/09 | 30/09 | 30/09 | 30/09 | 30/09 | 30/09 | 30/09 | 30/06 | 30/09 | 30/09 | 30/09 | 30/09 | 30/09 | 30/06 | 30/09 | 30/09 | 30/09 | 30/09 | 30/09 | 30/09 | 30/09 | 30/06 | 30/09 | 30/06 | 30/09 |
| 52-week high | 191.66 | 4.60 | 28.24 | 1376.50 | 45.14 | 10.49 | 285 | 280.80 | 68.40 | 479.10 | 39.00 | 181.80 | 7.21 | 14.70 | 200.50 | 66.86 | 11.94 | 38.66 | 42.00 | 293.80 | 15.92 | 26 | 42.70 | 27.50 | 74.45 | 33.92 | 202.20 | 80.00 | 4.67 | 88.80 | 78.25 | – | 141.20 | 1.59 | 172.00 | 225 | 86.35 | 74.20 | 67.80 | 110.20 | 24.20 |
| 52-week low | 100.35 | 3.28 | 14.12 | 953.40 | 24.56 | 3.28 | 165 | 22.28 | 44.10 | 338.80 | 28.30 | 150.80 | 2.68 | 9.02 | 22.62 | 43.72 | 6.13 | 24.22 | 28.85 | 163.00 | 11.13 | 16 | 25.10 | 17.54 | 53.45 | 21.66 | 127.20 | 37.70 | 2.53 | 65.20 | 57.70 | – | 71.35 | 0.85 | 136.15 | 160 | 48.26 | 63.20 | 48.35 | 69.50 | 13.10 |
| Vs 52-week high | -33.0% | -2.1% | -3.3% | -14.7% | -28.4% | -68.2% | -29.5% | -23.3% | -19.6% | -1.6% | -16.4% | -10.3% | -34.7% | -38.4% | -51.0% | -14.2% | -2.5% | -19.2% | -8.5% | -2.0% | -27.3% | -3.4% | -19.1% | -29.5% | -7.5% | -27.4% | -12.9% | -40.3% | -43.3% | -16.4% | -7.4% | – | -35.9% | -43.4% | -4.6% | -11.1% | -29.1% | -8.1% | -13.6% | -2.7% | -44.2% |
| Vs 52-week low | 27.9% | 37.6% | 93.3% | 23.1% | 31.6% | 1.6% | 21.8% | 866.2% | 24.7% | 39.2% | 15.2% | 8.1% | 75.7% | 0.4% | 334.0% | 31.2% | 89.9% | 28.9% | 33.2% | 76.6% | 4.0% | 61.0% | 37.6% | 10.6% | 28.9% | 13.8% | 38.5% | 26.8% | 4.5% | 13.8% | 25.6% | – | 26.8% | 5.9% | 20.5% | 24.8% | 26.8% | 7.9% | 21.2% | 54.2% | 3.1% |
| Volume, previous day | 166,887 | 104,590 | 41,153 | 11,060 | 4,045 | 7,862,421 | 3,082 | 7,023,751 | 302 | 32,518 | 23,630 | 78 | 139,913 | 4,643 | 10,664 | 32,851 | 707 | 9,334 | 2,633 | 20,224 | 86,797 | 384,448 | 2,340 | 67 | 55,137 | 19,421 | 40,354 | 221 | 40,390 | 99 | 1,143 | – | 20,171 | 2 | 40,331 | 182 | 11,224 | 1 | 636 | 4,673 | 6 |
| Current price | 128.32 | 4.51 | 27.30 | 1173.50 | 32.32 | 3.33 | 201 | 215.27 | 55.00 | 471.60 | 32.60 | 163.00 | 4.71 | 9.06 | 98.16 | 57.34 | 11.64 | 31.22 | 38.42 | 287.80 | 11.58 | 25 | 34.55 | 19.40 | 68.90 | 24.64 | 176.15 | 47.80 | 2.64 | 74.20 | 72.45 | – | 90.45 | 0.90 | 164.10 | 200 | 61.20 | 68.20 | 58.60 | 107.20 | 13.50 |
| Shares outstanding (m) | 861.1 | 110.3 | 212.8 | 363.9 | 126.0 | 2,904.6 | 54.9 | 404.0 | 10.2 | 374.0 | 150.9 | 9.2 | 115.6 | 219.6 | 35.8 | 144.4 | 109.3 | 80.3 | 55.2 | 59.5 | 620.0 | 1,342.9 | 25.8 | 7.5 | 162.7 | 118.9 | 537.6 | 14.2 | 134.5 | 4.0 | 46.9 | 416.5 | 265.9 | 34.6 | 573.4 | 5.2 | 96.0 | 7.2 | 15.9 | 115.4 | 10.7 |
| Market value | |||||||||||||||||||||||||||||||||||||||||
| Market cap (m) | 109,072 | 497 | 5,846 | 4,270 | 4,072 | 9,789 | 11,026 | 87,103 | 561 | 176,459 | 5,045 | 1,549 | 530 | 1,989 | 3,516 | 8,279 | 1,273 | 2,507 | 2,119 | 17,161 | 7,180 | 34,222 | 891 | 145 | 11,217 | 2,930 | 104,165 | 681 | 356 | 295 | 3,163 | – | 25,064 | 32 | 94,094 | 1,087 | 5,875 | 490 | 960 | 12,650 | 156 |
| Total debt | 4,388 | 804 | 3,905 | 1,519 | 865 | 55,999 | 14,289 | 4,229 | 436 | 99,011 | 1,709 | 639 | 379 | 1,607 | 612 | 3,904 | 191 | 1,152 | 1,838 | 1,756 | 4,972 | 2,765 | 780 | 299 | 384 | 810 | 12,790 | 84 | 18,694 | 65 | 4,630 | 2,039 | 14,425 | 64 | 40,468 | 61 | 291 | 14 | 598 | 1,930 | 148 |
| Preferred stock | – | – | – | – | – | – | – | – | – | – | – | – | – | – | – | – | – | – | – | – | – | – | – | – | – | – | – | – | 298 | – | 42 | – | – | – | – | – | – | – | – | – | – |
| Minority interest | 510 | – | 124 | 6 | 2 | 472 | 1,722 | – | 5 | 3,682 | 753 | – | – | 7 | – | 41 | (1) | 10 | 16 | 21 | – | 5 | 1 | (0) | 0 | 6 | 57 | – | 2 | 0 | – | 173 | 297 | – | 11 | 344 | 159 | 2 | 1 | 22 | 55 |
| Cash & equivalents | 12,824 | 22 | 1,329 | 531 | 391 | 30,362 | 5,978 | 5,171 | 46 | 25,654 | 252 | 25 | 78 | 168 | 564 | 967 | 1,826 | – | 73 | 688 | 1,476 | 3,814 | 174 | 48 | 443 | 147 | 15,613 | 132 | – | 81 | 29 | 6,978 | 13,495 | 49 | 8,327 | 819 | 1,532 | 74 | 162 | 3,737 | 24 |
| Enterprise value (m) | 101,146 | 1,279 | 8,546 | 5,264 | 4,548 | 9,428 | 21,059 | 86,161 | 957 | 232,113 | 7,255 | 2,162 | 831 | 1,897 | 3,564 | 11,257 | (382) | 2,284 | 3,901 | 18,249 | 11,089 | 33,179 | 1,499 | 396 | 11,159 | 3,599 | 110,012 | 634 | 16,451 | 279 | 7,806 | – | 26,194 | 46 | 126,246 | 674 | 4,796 | 432 | 1,392 | 10,865 | 335 |
| Analysts | |||||||||||||||||||||||||||||||||||||||||
| Buy ratings | 26 | 3 | 9 | 10 | 14 | 4 | 3 | 4 | 4 | 8 | 1 | 1 | 2 | 1 | 11 | 3 | 6 | 10 | 7 | 7 | 21 | 7 | 8 | 4 | 11 | 3 | 23 | 3 | 2 | 1 | 8 | – | 15 | 2 | 9 | 3 | 15 | 2 | 6 | 7 | 3 |
| Hold ratings | 5 | 1 | 4 | 9 | 1 | 20 | 6 | 16 | – | 9 | 5 | 2 | 4 | 1 | 6 | 14 | – | 2 | 4 | 13 | 3 | 11 | 1 | – | 8 | 7 | 9 | – | 2 | – | – | 2 | 5 | 2 | 6 | 1 | 3 | 1 | – | – | 2 |
| Sell ratings | 2 | – | – | 4 | 2 | 7 | 5 | 5 | – | 6 | 1 | – | – | 3 | 2 | 4 | – | – | 1 | 3 | 1 | 4 | – | – | 2 | 1 | 1 | – | 2 | – | – | 2 | 1 | – | 4 | – | 1 | – | – | – | – |
| Target price (12m) | 189.37 | 4.78 | 29.10 | 1,256.85 | 43.77 | 4.94 | 213.51 | 166.09 | 72.33 | 464.18 | 31.38 | 181.00 | 6.35 | 9.03 | 173.44 | 58.94 | 13.62 | 40.62 | 48.39 | 274.37 | 16.76 | 25.39 | 43.17 | 27.00 | 73.13 | 26.68 | 210.20 | 76.67 | 3.10 | 100.00 | 93.88 | 38.33 | 124.49 | 2.72 | 169.36 | 218.67 | 84.06 | 78.00 | 77.40 | 129.49 | 18.63 |
| Return potential | 47.6% | 6.2% | 6.6% | 7.1% | 35.4% | 48.2% | 6.2% | -22.8% | 31.5% | -1.6% | -3.8% | 11.0% | 34.8% | -0.3% | 76.7% | 2.8% | 17.0% | 30.1% | 26.0% | -4.7% | 44.8% | -0.3% | 24.9% | 39.2% | 6.1% | 8.3% | 19.3% | 60.4% | 17.2% | 34.8% | 29.6% | n.m. | 37.6% | 202.8% | 3.2% | 9.3% | 37.3% | 14.4% | 32.1% | 20.8% | 38.0% |
| Estimates | |||||||||||||||||||||||||||||||||||||||||
| LFYSales (m) | 44,243 | 129 | 3,673 | 2,420 | 6,406 | 153,508 | 20,236 | 1,944 | 1,429 | 112,758 | 6,018 | 90 | 669 | 2,558 | 592 | 15,172 | 1,085 | 6,466 | 2,075 | 3,606 | 549 | 6,236 | 1,735 | 482 | 5,495 | 2,440 | 22,420 | 696 | 2,237 | 324 | 4,283 | 60,954 | 49,848 | 181 | 155,113 | 1,170 | 3,079 | 81 | 1,534 | 18,714 | 392 |
| FY+1 | 51,155 | 132 | 4,205 | 2,546 | 6,972 | 160,971 | 21,365 | 2,292 | 1,554 | 166,819 | 7,131 | 153 | 678 | 2,563 | 746 | 15,679 | 1,157 | 6,528 | 2,173 | 3,902 | 614 | 6,445 | 2,028 | 532 | 5,863 | 3,098 | 25,327 | 861 | 368 | 356 | 4,652 | 58,766 | 55,778 | 167 | 151,447 | 1,182 | 3,293 | 21 | 1,678 | 21,120 | 350 |
| FY+2 | 58,029 | 131 | 4,404 | 2,686 | 7,415 | 164,423 | 22,602 | 2,690 | 1,706 | 174,634 | 7,711 | 123 | 697 | 2,658 | 960 | 15,723 | 1,229 | 6,828 | 2,244 | 4,174 | 704 | 6,940 | 2,071 | 546 | 6,212 | 3,149 | 27,373 | 993 | 426 | 366 | 4,922 | 59,022 | 61,783 | 171 | 158,300 | 1,249 | 3,450 | 22 | 1,754 | 23,066 | 375 |
| LFYEV/Sales | 2.3x | 9.9x | 2.3x | 2.2x | 0.7x | 0.1x | 1.0x | 44.3x | 0.7x | 2.1x | 1.2x | 24.0x | 1.2x | 0.7x | 6.0x | 0.7x | -0.4x | 0.4x | 1.9x | 5.1x | 20.2x | 5.3x | 0.9x | 0.8x | 2.0x | 1.5x | 4.9x | 0.9x | 7.4x | 0.9x | 1.8x | – | 0.5x | 0.3x | 0.8x | 0.6x | 1.6x | 5.3x | 0.9x | 0.6x | 0.9x |
| FY+1 | 2.0x | 9.7x | 2.0x | 2.1x | 0.7x | 0.1x | 1.0x | 37.6x | 0.6x | 1.4x | 1.0x | 14.1x | 1.2x | 0.7x | 4.8x | 0.7x | -0.3x | 0.3x | 1.8x | 4.7x | 18.1x | 5.1x | 0.7x | 0.7x | 1.9x | 1.2x | 4.3x | 0.7x | 44.7x | 0.8x | 1.7x | – | 0.5x | 0.3x | 0.8x | 0.6x | 1.5x | 20.4x | 0.8x | 0.5x | 1.0x |
| FY+2 | 1.7x | 9.8x | 1.9x | 2.0x | 0.6x | 0.1x | 0.9x | 32.0x | 0.6x | 1.3x | 0.9x | 17.6x | 1.2x | 0.7x | 3.7x | 0.7x | -0.3x | 0.3x | 1.7x | 4.4x | 15.8x | 4.8x | 0.7x | 0.7x | 1.8x | 1.1x | 4.0x | 0.6x | 38.7x | 0.8x | 1.6x | – | 0.4x | 0.3x | 0.8x | 0.5x | 1.4x | 19.4x | 0.8x | 0.5x | 0.9x |
| LFYEBITDA (m) | 6,670 | 98 | 1,241 | 549 | 500 | (14,764) | 3,319 | (2,770) | 129 | – | 680 | 36 | 147 | 409 | 14 | 1,017 | 162 | 330 | 623 | 1,034 | 401 | 1,988 | 224 | 106 | 893 | 524 | 6,294 | 48 | 1,581 | 33 | 1,434 | 1,444 | 2,387 | 2 | 16,448 | 189 | 586 | 61 | 187 | 1,960 | 40 |
| FY+1 | 9,142 | 96 | 883 | 579 | 546 | 9,018 | 2,887 | (2,966) | 131 | – | 936 | 143 | 129 | 394 | 212 | 1,429 | 154 | 341 | 636 | 1,066 | 446 | 2,316 | 341 | 112 | 1,000 | 507 | 7,294 | 64 | 101 | 37 | 1,496 | 1,221 | 3,463 | (7) | 15,091 | 248 | 614 | (11) | 219 | 2,056 | 41 |
| FY+2 | 11,604 | 96 | 933 | 665 | 584 | 10,758 | 2,982 | (1,706) | 157 | – | 1,051 | 113 | 123 | 403 | 346 | 1,394 | 170 | 450 | 671 | 1,161 | 506 | 2,467 | 290 | 118 | 1,091 | 542 | 8,177 | 80 | 163 | 39 | 1,590 | 1,391 | 3,862 | 2 | 16,164 | 261 | 669 | (12) | 241 | 2,222 | 51 |
| LFYEV/EBITDA | 15.2x | 13.1x | 6.9x | 9.6x | 9.1x | -0.6x | 6.3x | -31.1x | 7.4x | – | 10.7x | 60.0x | 5.6x | 4.6x | 246.2x | 11.1x | -2.4x | 6.9x | 6.3x | 17.6x | 27.6x | 16.7x | 6.7x | 3.7x | 12.5x | 6.9x | 17.5x | 13.2x | 10.4x | 8.5x | 5.4x | – | 11.0x | 23.3x | 7.7x | 3.6x | 8.2x | 7.1x | 7.5x | 5.5x | 8.3x |
| FY+1 | 11.1x | 13.3x | 9.7x | 9.1x | 8.3x | 1.0x | 7.3x | -29.1x | 7.3x | – | 7.8x | 15.1x | 6.4x | 4.8x | 16.8x | 7.9x | -2.5x | 6.7x | 6.1x | 17.1x | 24.8x | 14.3x | 4.4x | 3.5x | 11.2x | 7.1x | 15.1x | 10.0x | 162.8x | 7.5x | 5.2x | – | 7.6x | -6.5x | 8.4x | 2.7x | 7.8x | -38.2x | 6.3x | 5.3x | 8.1x |
| FY+2 | 8.7x | 13.4x | 9.2x | 7.9x | 7.8x | 0.9x | 7.1x | -50.5x | 6.1x | – | 6.9x | 19.1x | 6.8x | 4.7x | 10.3x | 8.1x | -2.3x | 5.1x | 5.8x | 15.7x | 21.9x | 13.5x | 5.2x | 3.4x | 10.2x | 6.6x | 13.5x | 7.9x | 100.8x | 7.1x | 4.9x | – | 6.8x | 22.5x | 7.8x | 2.6x | 7.2x | -37.2x | 5.8x | 4.9x | 6.6x |
| LFYEPS | 4.51 | 0.31 | 1.18 | 0.22 | 1.85 | (6.51) | 15.84 | (7.24) | 5.60 | 30.95 | 1.04 | 2.48 | 0.48 | 0.12 | (6.08) | 1.78 | 0.57 | 1.98 | 2.63 | 10.73 | 0.73 | 0.97 | 2.93 | 1.68 | 2.66 | 2.28 | 6.13 | 3.01 | (2.06) | 4.65 | 6.06 | 2.81 | 2.04 | (0.70) | 13.53 | 8.61 | 2.93 | 8.27 | 1.46 | 7.32 | (0.03) |
| FY+1 | 6.46 | 0.37 | 1.46 | 0.38 | 2.00 | 0.42 | 10.67 | (7.57) | 5.44 | 30.87 | 2.45 | 9.40 | 0.33 | 0.07 | 0.95 | 3.99 | 0.76 | 2.23 | 2.85 | 11.46 | 0.54 | 1.36 | 5.29 | 2.22 | 3.31 | 2.04 | 7.55 | 2.29 | 0.04 | 5.16 | 7.03 | 1.49 | 4.21 | (0.74) | 12.74 | 15.60 | 3.32 | 8.32 | 6.01 | 8.02 | 0.50 |
| FY+2 | 8.84 | 0.41 | 1.60 | 0.56 | 2.19 | 0.79 | 10.45 | (4.43) | 7.10 | 33.41 | 3.00 | 8.31 | 0.33 | 0.10 | 3.94 | 3.90 | 0.84 | 3.26 | 3.29 | 12.62 | 0.57 | 1.41 | 4.09 | 2.15 | 3.76 | 2.30 | 8.55 | 3.09 | 0.37 | 5.46 | 7.61 | 1.65 | 5.10 | (0.43) | 13.88 | 16.74 | 3.62 | 8.48 | 6.37 | 8.90 | 0.77 |
| LFYP/E | 28.5x | 14.6x | 23.2x | 54.4x | 17.5x | – | 12.7x | – | 9.8x | 15.5x | 31.4x | 65.7x | 10.3x | 17.3x | – | 32.2x | 20.5x | 15.8x | 14.6x | 26.8x | 15.8x | 26.6x | 11.8x | 12.4x | 26.0x | 10.8x | 31.2x | 15.9x | – | 15.9x | 12.0x | – | 44.3x | – | 12.1x | 23.2x | 20.9x | 8.2x | 40.2x | 14.7x | – |
| FY+1 | 19.9x | 12.2x | 18.7x | 30.6x | 16.1x | 8.0x | 18.8x | – | 10.1x | 15.3x | 13.3x | 17.3x | 14.1x | 29.3x | 103.2x | 14.4x | 15.4x | 14.0x | 13.5x | 25.1x | 21.4x | 18.7x | 6.5x | 8.8x | 20.8x | 12.1x | 25.2x | 20.8x | 67.4x | 14.4x | 10.3x | – | 21.5x | – | 12.9x | 12.8x | 18.5x | 8.2x | 9.8x | 13.4x | 27.1x |
| FY+2 | 14.5x | 10.9x | 17.1x | 20.8x | 14.8x | 4.2x | 19.2x | – | 7.8x | 14.1x | 10.9x | 19.6x | 14.2x | 21.6x | 24.9x | 14.7x | 13.9x | 9.6x | 11.7x | 22.8x | 20.4x | 18.0x | 8.5x | 9.0x | 18.3x | 10.7x | 22.3x | 15.5x | 7.2x | 13.6x | 9.5x | – | 17.7x | – | 11.8x | 11.9x | 16.9x | 8.0x | 9.2x | 12.1x | 17.5x |
| Growth and margins | |||||||||||||||||||||||||||||||||||||||||
| 1 YearRevenue growth | 13.2% | -4.1% | 1.1% | -1.7% | 1.6% | -2.1% | 5.5% | -39.9% | 9.4% | -22.6% | -3.8% | 4.3% | -0.4% | 0.1% | -33.5% | -6.6% | 1.5% | 45.3% | 1.4% | -6.7% | 9.2% | 0.4% | 0.8% | 7.7% | 1.4% | -1.5% | 4.8% | 8.3% | -19.5% | 1.3% | 7.0% | -12.5% | 19.7% | -16.3% | -4.2% | 9.5% | 9.6% | 131.0% | 43.5% | 7.4% | -12.6% |
| 5 Year | 9.3% | -2.3% | 12.1% | 1.4% | 5.0% | 44.0% | 26.7% | 409.3% | 6.9% | 1.7% | 0.1% | 9.8% | 66.5% | 11.3% | 4.3% | 6.7% | 7.4% | 16.2% | 7.6% | 7.5% | 5.7% | 7.1% | 2.3% | 1.9% | 3.5% | -1.0% | 11.7% | 13.3% | 11.0% | 11.4% | 23.8% | 35.9% | 11.7% | 2.7% | 8.1% | 11.7% | 96.4% | 53.6% | 16.1% | 5.0% | -9.4% |
| 1 YearEBITDA growth | 70.2% | -4.5% | -0.4% | 23.4% | 1.1% | -201.6% | 43.2% | 24.2% | 32.9% | – | -29.6% | -9.6% | 31.1% | -6.0% | -94.7% | -33.5% | 1.0% | 54.0% | 0.4% | 3.2% | 5.2% | 1.3% | -5.7% | 7.1% | 7.5% | -0.6% | 3.4% | 34.7% | -32.8% | -6.2% | -2.4% | -50.4% | 38.6% | 145.1% | 21.4% | 43.7% | 7.8% | 235.4% | 7.6% | -32.4% | -31.3% |
| 5 Year | 40.9% | -1.3% | 5.8% | -0.8% | 5.1% | -5.8% | 29.0% | 370.7% | 53.4% | – | -8.0% | -105.5% | 156.8% | 21.6% | -0.7% | 8.0% | 17.2% | 74.6% | 4.4% | 10.8% | 3.2% | 8.9% | 12.2% | 1.0% | 10.7% | 3.8% | 21.9% | 11.3% | 10.5% | 10.0% | 30.6% | -89.3% | 36.2% | -85.0% | 20.3% | 34.9% | 987.5% | 81.1% | 7.5% | 20.3% | -5.4% |
| LTMEBITDA margin | 15.1% | 77.6% | 35.1% | 23.6% | 8.0% | -0.4% | 13.2% | -71.1% | 9.3% | – | 11.8% | 40.8% | – | 15.5% | 2.4% | 8.7% | 15.6% | 4.6% | 29.8% | 30.2% | 72.5% | 34.2% | 18.3% | 21.9% | 16.4% | 16.7% | 29.5% | 7.0% | 21.6% | 10.3% | 33.3% | 0.1% | 5.4% | 1.6% | 9.9% | 19.7% | 18.7% | 84.8% | 13.2% | 10.5% | 8.6% |
| FY+1 | 17.9% | 73.2% | 21.0% | 22.7% | 7.8% | 5.6% | 13.5% | -129.4% | 8.4% | – | 13.1% | 93.7% | 19.0% | 15.4% | 28.5% | 9.1% | 13.3% | 5.2% | 29.3% | 27.3% | 72.7% | 35.9% | 16.8% | 21.0% | 17.1% | 16.4% | 28.8% | 7.4% | 27.5% | 10.4% | 32.1% | 2.1% | 6.2% | -4.3% | 10.0% | 21.0% | 18.7% | -53.3% | 13.1% | 9.7% | 11.8% |
| FY+2 | 20.0% | 73.2% | 21.2% | 24.8% | 7.9% | 6.5% | 13.2% | -63.4% | 9.2% | – | 13.6% | 92.1% | 17.7% | 15.1% | 36.0% | 8.9% | 13.8% | 6.6% | 29.9% | 27.8% | 71.9% | 35.5% | 14.0% | 21.6% | 17.6% | 17.2% | 29.9% | 8.1% | 38.4% | 10.7% | 32.3% | 2.4% | 6.3% | 1.2% | 10.2% | 20.9% | 19.4% | -52.0% | 13.7% | 9.6% | 13.5% |
| Balance sheet | |||||||||||||||||||||||||||||||||||||||||
| Total debt / equity | 39% | 80% | 170% | 160% | 40% | 91% | 302% | 62% | 116% | 163% | 43% | 58% | 153% | 444% | 46% | 85% | 31% | 188% | 452% | 63% | 53% | 29% | 96% | 228% | 15% | 56% | 55% | 36% | 670% | 47% | 203% | 18% | 255% | 193% | 91% | 9% | 26% | 2% | 138% | 35% | 119% |
| Total debt / capital | 27% | – | 62% | 61% | 29% | 48% | 69% | 38% | 53% | 61% | 27% | 37% | – | 81% | 32% | 46% | 24% | – | 81% | 38% | 35% | 22% | 49% | 70% | 13% | 36% | 35% | – | – | 32% | 67% | 15% | 71% | – | 48% | – | 19% | 2% | – | 26% | 45% |
| Total debt / EBITDA | 0.7x | 8.1x | 3.0x | 2.6x | 1.6x | – | 5.1x | – | 3.2x | – | 2.4x | 17.2x | – | 4.1x | 42.3x | 2.9x | 1.0x | 3.8x | 2.9x | 1.6x | 11.4x | 1.3x | 2.2x | 2.8x | 0.4x | 1.7x | 1.8x | 1.2x | 39.7x | 1.8x | 3.0x | 25.5x | 4.9x | 23.1x | 2.7x | 0.3x | 0.5x | 0.1x | 2.7x | 0.9x | 4.8x |
| Net debt / EBITDA | -1.3x | 7.9x | 2.0x | 1.7x | 0.9x | – | 3.0x | – | 2.9x | – | 2.0x | 16.6x | – | 3.7x | 3.3x | 2.2x | -9.0x | -0.8x | 2.7x | 1.0x | 8.9x | -0.5x | 1.7x | 2.4x | -0.1x | 1.4x | -0.4x | -0.7x | 33.5x | -0.5x | 3.0x | -59.5x | 0.3x | 5.3x | 2.1x | -3.3x | -2.0x | -0.6x | 2.0x | -0.9x | 4.0x |
| EBITDA / interest | 34.9x | – | 9.3x | 6.7x | 17.6x | -0.4x | 4.1x | – | – | – | 20.2x | 5.0x | – | 4.6x | 0.9x | 5.6x | 7.4x | – | 8.3x | 14.1x | 2.9x | 47.1x | 12.0x | 4.5x | 20.2x | 14.0x | 7.5x | 7.2x | – | 19.6x | 10.7x | 0.3x | 3.1x | – | 7.7x | – | 13.6x | – | 6.3x | 37.9x | 6.7x |
Local currency; market cap in millions. Source: Bloomberg, analyst consensus. On a phone, swipe the table sideways to see every company.
Siemens Energy (ENR Germany): A plan that pays for itself
● VERY POSITIVE
Record year and a 2030 plan backed by €55bn of cash.
Price 128.32 · P/E next yr 19.9x · Upside 47.6%
Siemens Energy finished its financial year with figures that would have been hard to imagine two years ago. Revenue rose 15.5% on a comparable basis to €44.2bn, profit before special items more than doubled to €5.5bn, a margin of 12.4% against 6.0%, and net income reached slightly above €4.1bn. Pre-tax free cash flow was €8.8bn. Siemens Gamesa, the wind business that nearly sank the group, broke even with a profit of €8m after a €1.4bn loss. The dividend jumps from €0.70 to €2.30 per share.
The new 2030 plan is ambitious but rests on firm ground. Siemens Energy targets comparable revenue growth of 12–14% a year, which would take sales to roughly €70–75bn, and a margin of 20–22%. For next year it guides for revenue growth of 14–16%, a margin of 14–16%, net income of about €5bn and pre-tax free cash flow of about €10bn. The backlog of €164bn, 3.7 years of revenue, already covers about 85% of next year's sales, and most of the margin improvement depends on executing that backlog at the prices already agreed. Gas Services has raised its margin on new equipment orders sharply since 2022 and targets 25–27% by 2030, Grid Technologies 24–26%.
The market's concern is data centres. Since the summer, worries about AI spending and the financing of hyperscalers have hit the shares. Siemens Energy's answer is that data centres make up less than 10% of its order book, about €15bn. In gas turbines the share is higher, around a quarter, and probably more in the US. But Gas Services alone has 104 GW of commitments, of which 65 GW are firm orders, and expects services revenue to double to €16bn by 2035. Grid demand comes mostly from replacing ageing networks and connecting new demand of all kinds.
The cash plan stands out most. Siemens Energy expects €55bn of pre-tax free cash flow from 2027 to 2030, which means an average of €15bn a year in the three years after 2027. About 45%, or €27bn, will go back to shareholders, including up to €9bn of new buybacks through 2030.
The weak point is the fourth-quarter order intake. Orders were €14.8bn, up 5.2%, but Grid Technologies fell 19.3% and Gas Services booked only 2 GW of firm orders, with another 14 GW reserved. One soft quarter does not undo a €164bn backlog, but it is the figure to watch in February.
IGD (IGD Italy): Third guidance increase this year
● POSITIVE
Third FFO upgrade, falling leverage, and a dividend with room to grow.
Price 4.51 · P/E next yr 12.2x · Upside 6.2%
IGD has raised its 2026 FFO guidance for the third time this year. In February it expected at least €45m, in August at least €46m and now at least €47m, 14% more than the €41.2m of 2025. After nine months it has €36.6m, up 17.7%, so the new target only requires €10.4m in the fourth quarter, against an average of more than €12m in each of the first three. Another beat looks likely. Most of the growth came from lower recurring financing costs, after more than €1bn of refinancing last year and a €165m green loan in February.
The Italian shopping centres are performing well. Footfall rose 4.1% and tenant sales 4.2% over nine months, slightly below the first half but still solid. Occupancy in malls and hypermarkets edged up to 96.31%, and the 148 leases signed, about 9% of mall rents, came with an average increase of 1.8%, better than the 0.9% of the first half. Last year IGD brought in 27 new international brands, among them Ikea, Action and Sephora, and that work now shows in occupancy. Inflation also helps, because most leases are indexed at the start of the year.
The balance sheet is slowly getting lighter. LTV fell to 42.9% from 43.5% at the end of 2025, and IGD targets close to 40% by the end of 2027. Romanian disposals continue: nine of the original 15 properties have now been sold for €35.6m, and in Romania occupancy also rose, to 93.21%. In Livorno, IGD has completed the sale of the entire residential part of the Porta a Mare waterfront project, which removes a development that never fitted a shopping centre landlord. In October Fitch moved the outlook on IGD's BBB- rating to positive. Net debt is still 8.0x EBITDA and interest cover only 2.3x, and the weighted average cost of debt was 5.0% at the end of September, slightly higher than in June, so the refinancing gains are not finished.
IGD's earnings now grow for operating reasons as well as financial ones, and the dividend has room to rise. Last year's €0.15 per share took up only about a third of FFO, which works out at around €0.42 per share on this year's guidance. At roughly 10–11x this year's FFO, the shares still price in little of the improvement. IGD remains a leveraged company in a sector investors avoid, but the trend in every one of its key figures has turned positive.
JCDecaux (DEC France): The rerating has happened
● NEUTRAL
Business in great shape, but the old discount has now closed.
Price 27.30 · P/E next yr 18.7x · Upside 6.6%
JCDecaux keeps growing faster than the advertising market. Third-quarter revenue rose 9.1% to €1,010.5m, 6.6% on an organic basis, and nine-month organic growth was 6.0%. The company expects about 6% again in the fourth quarter. Street furniture grew 7.3% in the quarter and transport 7.7%, with double-digit growth in the UK and North America, while billboards grew only 1.4% because JCDecaux cut inventory in France. The football World Cup helped. Only the Middle East declined, because of the conflict in the region.
Digital is the driver. It made up 45.4% of revenue in the quarter and grew 15.3% organically. Programmatic sales, where advertisers buy screen time automatically through online platforms, rose 37.5% and account for 13.3% of digital revenue. Programmatic sales help margins, because they open outdoor advertising to the large budgets that used to go to online channels and need fewer salespeople. The digital screens of Ströer in Germany grew 11% in the same quarter, so JCDecaux is clearly outperforming.
Profit has followed. In the first half the operating margin rose 190bp to 18.4% and adjusted EBIT 53.5% to €136.2m. Free cash flow was a positive €26.2m in the first half, against an outflow of €64.9m a year earlier, and net debt was €284m lower than twelve months before, at €628.8m, with €1.3bn of cash and an undrawn €825m credit line behind it. Contract renewals have also gone its way, among them a 15-year renewal in Hamburg. Since last year management has put cash generation first, and for the first time it gave a free cash flow target for 2026, €300m, which it looks likely to exceed. The dividend was reinstated with €0.65 per share for 2025.
The shares now reflect this. JCDecaux was for years valued at a large discount because it consumed cash and paid no dividend, and that discount has closed. The business is in very good shape, competition in Europe is more fragmented than before, and new contract wins could add to growth. But the macro outlook for 2027 is uncertain, especially in Europe, and a lot of the improvement in cash flow is now known. For further gains in the shares, growth will have to beat the current 6% pace or management will have to use its stronger balance sheet for acquisitions.
Burberry (BRBY UK): Five quarters of growth, but margins are still thin
● NEUTRAL
Turnaround is visible in sales; margins remain far below past levels.
Price 1173.50 · P/E next yr 30.6x · Upside 7.1%
Burberry's turnaround under Joshua Schulman is now visible in the numbers. First-half revenue rose 6% to £1,098m and adjusted operating profit more than tripled to £62m, a margin of 5.7%. On a reported basis the company is profitable again, with £54m against an £18m loss a year earlier. Comparable retail sales grew 4% in the half, 5% in the first quarter and 4% in the second, the fifth quarter of growth in a row. Gross margin improved 40bp to 68.3%.
The regions moved apart. The Americas grew 12% and showed no slowdown in the second quarter, and Greater China, where the luxury market is weak, still grew 5% in the second quarter after 9% in the first. Asia Pacific added 3%. Europe, the Middle East, India and Africa fell 2%, because fewer tourists came to Europe. Outerwear, the brand's traditional strength, grew by double digits, and leather goods accelerated in the second quarter. Management also says the number of Gen Z customers is growing by double digits, and after scarves, polo shirts and trench coats it is now giving cashmere its own sections in the stores. That last point is important, because bags are where Burberry lost most ground in recent years and where margins are highest.
Wholesale grew 17%, well above the guidance, mainly because department stores and partners restocked after reducing orders. Burberry now expects wholesale growth of 10–12% for the year, which implies a much slower second half. Free cash flow was negative at £147m, against an outflow of £50m a year earlier, which the company says was planned. Capital expenditure for the year has been cut to about £100m from £120m. The expected tax rate has gone up to 30–34%, from 27–30%, which takes some of the operating improvement away before it reaches earnings per share, although the company expects the rate to return to normal over the coming years.
The company only says it expects further growth in revenue and margin for the full year, and management indicated it is comfortable with market expectations of about £245m of operating profit. That would mean about £183m in the second half, three times the first. Burberry's second half is always much stronger, but even £245m would be a margin below 10%, far from the high-teens margins of the past. The brand is recovering. The profit is not there yet, and in the meantime a lot of the recovery is already priced into the shares.
Bechtle (BC8 Germany): Growth paid for with working capital
● NEUTRAL
Second guidance raise, but growth is tying up working capital.
Price 32.32 · P/E next yr 16.1x · Upside 35.4%
Bechtle had a strong third quarter and raised its guidance for the second time this year. Business volume, the company's measure of gross sales, rose 19.0% to €2.44bn, with Germany up 20.8%, Benelux 19.1% and the other European countries 20.5%. France lagged with 4.7%. Revenue grew a more modest 6.1%, because a large part of the growth came from software licences, which under IFRS 15 are often booked net, as a commission. Pre-tax profit rose 13.9% to €91.7m and earnings per share 11.1% to €0.50. Demand came from both public and private customers. The gap between the two measures is clearest by country: in France business volume grew 4.7% while revenue fell 9.2%, and in Germany volume rose 20.8% while revenue grew only 2.9%. Benelux and the rest of Europe grew strongly on both measures, with revenue up 17.8% and 15.4%.
The guidance change concerns profit. Bechtle now expects EBT growth of more than 10% for the year, against 5–10% before, while business volume should still grow more than 10% and revenue 5–10%. After nine months that looks cautious. Bechtle says the strong trend continued into the fourth quarter and the order backlog reached a record of about €3.6bn, 32% more than a year earlier.
The weak spot is cash. Strong orders in September pushed up working capital, which turned operating cash flow negative for the quarter, and free cash flow for the first nine months was an outflow of about €272m. Net debt rose from about €340m at the end of June to €430m. That is not unusual for an IT reseller in a strong year, but the amounts are large, and much depends on how much cash comes back in the fourth quarter, traditionally Bechtle's strongest.
The margin tells the same story from another angle. EBT rose faster than revenue but slower than business volume, so the margin on business volume fell slightly, as the company itself expects for the year. Bechtle is gaining volume, especially in German public IT, where digitalisation spending is rising. That is the right market to be in, but investors should judge the year by the cash flow statement in March as much as by the growth figures.
Stellantis (STLAM Italy): Cost savings are being eaten by inflation
● NEGATIVE
Raw material inflation is eating into the cost savings plan.
Price 3.33 · P/E next yr 8.0x · Upside 48.2%
Stellantis's recovery depends on its cost program, and its CEO has just said a large part of the savings will be absorbed. Speaking at the annual assembly of Anfia, the Italian car parts association, Antonio Filosa warned of "significant raw material inflation" in 2027 and probably 2028, linked to memory chips, printed circuit boards and semiconductors, an increase measured "in billions of euros". The company later said this referred to its total annual cost base. It is the first clear sign that next year will not bring the margin recovery many investors expect.
The third quarter showed how thin the margin already is. Revenue rose 1% to €37.6bn, but adjusted operating income was only €256m, a margin of 0.7%. North America is recovering slowly, with a margin of 0.4% after losses a year earlier, sales up 1% and Ram sales up 30%. Europe went the other way, with a loss of €311m and a margin of minus 2.2%, because of lower prices and an unfavourable mix, and market share in the EU30 fell 0.6 points to 14.8%.
Industrial free cash flow was a negative €4.0bn in the quarter, and the industrial net cash position fell to €5.4bn from €6.7bn at the end of 2025.
The Value Creation Program targets €6bn of run-rate efficiencies, and Stellantis expects at least 40% of that, about €2.4bn, to be in place by the end of this year, with fourth-quarter savings of several hundred million euros. That leaves about €3.6bn for 2027 and later. If input costs rise by billions in the same period, most of the remaining savings will go to absorbing inflation, not to raising margins. Stellantis still expects positive industrial free cash flow in 2027, but that target was set before the CEO's warning.
There are positive elements. Leapmotor, the Chinese partner, will help develop the planned small electric cars, which will be built at Pomigliano in Italy from 2028, and North American inventory should be back at last year's level by December. Industrial liquidity of €42.7bn, 26% of revenue, is within the 25–30% target range. But that cushion is close to the bottom of the range after a heavy cash outflow, and Europe, the group's largest region by shipments, is still losing money. The shares have fallen sharply this year, but cheap is not the same as recovering, and 2027 now looks like another year of repair.
Acciona (ANA Spain): Strong operations, stalled asset sales
● NEGATIVE
Nordex and infrastructure perform; stalled disposals hold the group back.
Price 201 · P/E next yr 18.8x · Upside 6.2%
Acciona's operations are doing better than the group expected, but its plan to sell assets is not. The group now sees full-year EBITDA at the upper end of its €2.8–3.1bn range. The main reason is Nordex, the wind turbine maker it controls. Nordex nearly doubled nine-month EBITDA to €633m, its margin rose from 6.5% to 10.6% and reached 12.7% in the third quarter, and it raised its full-year margin guidance to 11.5–12.5% from 8–11%. Infrastructure is also solid, with a construction and services backlog of €22.6bn and a concession backlog of a record €141bn, 46% higher than a year earlier after new water concessions in Brazil.
The disappointment is the asset rotation. Acciona no longer expects to reach its target of about €2bn of disposals this year, mainly because the sale of US solar portfolios and Mexican wind farms to Mexico Infrastructure Partners, agreed in December 2025 for about $1bn, has not closed. The buyer has reportedly not secured financing. Acciona is investing less, about €2bn this year against €2.2–2.5bn planned, and still aims for net debt below 3.0x EBITDA, but the disposals were meant to support the balance sheet of Acciona Energía.
That subsidiary carries the weight. Acciona Energía confirmed EBITDA of about €1.2bn, helped by higher captured prices in the third quarter, though its nine-month average of €57.3/MWh was still 8% below last year. Output grew 3.9% to 18.6 TWh, but curtailments, weather and delays reduced it, and the full-year estimate is now about 25.5 TWh. Year-end net debt will be €3.25–3.5bn instead of below €3bn. To protect its credit rating, the parent is lending it €500m as a subordinated perpetual loan at 7.7%, structured to count as equity. Acciona Energía is cutting its own net investment to €0.7–0.75bn from about €0.9bn, and expects captured prices of €55–60/MWh for the year.
Some disposals should still happen. Acciona is working on other sales that it expects to complete in the fourth quarter, and cumulative equity invested in concessions has reached €1.07bn, a pool of assets that can be sold once they are operating. But the market has heard this before, and the MIP deal shows how a signed agreement can stall when the buyer's financing does not arrive.
The shares of both companies fell sharply after the update. That reaction makes sense. Acciona holds 91% of Acciona Energía, and every euro that the parent puts in to support its rating is a euro that does not go to the growth businesses, Nordex and infrastructure, which are performing well. As long as the disposals stall, the group remains a conglomerate whose best parts are held back by its most indebted one.
Moderna (MRNA US): The cancer vaccine can be made at scale
● POSITIVE
Investor day shows the cancer vaccine can be produced at scale.
Price 215.27 · Upside -22.8%
Moderna's investor day had one job: to show that intismeran, its personalised cancer vaccine developed with Merck, can be produced in large numbers at a reasonable cost. Each dose is made for one patient, based on the mutations in his or her tumour, so the manufacturing process is the commercial bottleneck. The Marlborough site in Massachusetts is already running and has produced more than 100 batches. Moderna aims for about six weeks between taking a tumour sample and giving the treatment, against an average of 64 days in the phase III trial. The site is modular and can add six production units to the first, enough for tens of thousands of patients a year, and each new equipment generation should cut costs by about half.
The clinical case is strong in melanoma. In the phase III trial in high-risk patients after surgery, intismeran combined with Keytruda reduced the risk of recurrence by 42% (hazard ratio 0.58) and of distant metastases by 38%. Moderna and Merck are preparing regulatory filings but have not given dates. The bigger question is whether the vaccine works in other cancers. Phase II data suggest a similar benefit in tumours with high and low mutation counts, which would open kidney and bladder cancer, and trials in lung, kidney and bladder cancer will answer that.
The rest of the business is improving faster than expected. Third-quarter revenue rose 29% to $1,313m, and Moderna made a net profit of $162m after a loss of $200m a year earlier. It raised its 2026 revenue growth guidance to 15–25%, from up to 10%, and cut R&D spending to about $2.7bn. The new flu vaccine, mFLUSIVA, is in a limited US launch this season. Cash and investments rose to $8.0bn and should reach $8.1–8.3bn at year-end.
Beyond intismeran, early data for mRNA-2808 in multiple myeloma showed responses in 4 of 11 patients, and mRNA-4194 is being tested as a preventive vaccine for people with Lynch syndrome, an inherited risk of colorectal and other cancers. These programs are small for now, but they show the platform can be used for very different oncology approaches. Cost of sales this year includes a $0.9bn litigation charge, so the underlying cost base is lower than the reported figure.
Moderna was priced as a company in decline a year ago, with respiratory vaccine sales falling and cash burning. It now has a growing revenue base, costs under control and a cancer product that works. Margins will only become clear once intismeran is approved and priced, and that depends on reimbursement in the US. Still, the event removed the main practical objection.
Rosenbauer (ROS Austria): Everything now depends on the fourth quarter
● NEGATIVE
Guidance cut leaves 37% of annual revenue to deliver in Q4.
Price 55.00 · P/E next yr 10.1x · Upside 31.5%
Rosenbauer cut its 2026 guidance after a third quarter in which revenue grew only 2% to €353m. The company now expects revenue of about €1.55bn and EBIT of about €90m, a margin of about 5.8%, against "up to €1.6bn" and a margin above 6% before. Deliveries to the Middle East, delayed earlier in the year, caught up less than planned. On top of that, the introduction of SAP S/4HANA caused unplanned costs, and the restructuring of the stationary fire protection business is slower than expected, with a loss of €4m in the quarter and €7m over nine months. Third-quarter EBIT was €22m, so the profit shortfall was smaller than the revenue gap.
Over nine months the results still look good. Revenue rose 2.9% to €978.6m, EBIT 27% to €42.4m and the net result swung to a profit of €16.6m from a loss of €3.1m. Order intake was €1.10bn, slightly below last year's €1.16bn, and the backlog was stable at €2.45bn, more than one and a half years of revenue. Third-quarter orders of €385m were lower than the €458m of a year earlier, a strong comparison, but higher than in the first two quarters, and the book-to-bill ratio for nine months was 1.13. Demand is not the problem.
The new guidance is still demanding. It implies fourth-quarter revenue of about €571m, 19% more than in the fourth quarter of 2025 and over 60% more than the third quarter. The implied fourth-quarter EBIT of about €48m is close to last year's €51m, on far higher revenue, so even the reduced target assumes the delays clear in the last weeks of the year. Rosenbauer has a history of heavy year-ends because public customers take delivery before budgets close, but this year the gap is larger than usual.
The longer-term case is intact. The backlog is large and the nine-month profit improvement is real. But a company that has to deliver almost 37% of its annual revenue in one quarter runs operating risk, especially in the middle of an ERP change. Even if it succeeds, the guidance means revenue growth of about 8% and EBIT growth of about 6.5% on 2025, so the margin barely moves this year. Investors should wait for the year-end figures before assuming the 2027 margin will move clearly above 6%.
Allianz (ALV Germany): Asset management is pulling its weight
● POSITIVE
Record nine months, with asset management now driving growth.
Price 471.60 · P/E next yr 15.3x · Upside -1.6%
Allianz had a record nine months, and the strongest growth came from the business investors often treat as an afterthought. Operating profit rose 7.8% to €14.1bn, and in the third quarter it grew 6.2% to €4.7bn. Core net income increased 10.6% to €9.3bn, core earnings per share 12.7% to €24.15, and core return on equity was 20.1%. Allianz raised the top of its full-year target range to about €18.6bn, from €17.4bn plus or minus €1bn. That leaves up to €4.5bn for the fourth quarter, a little below the third.
Asset management stood out. Operating profit rose 35.1% to a record €1.1bn in the third quarter, almost a quarter of the group total. Third-party net inflows reached €47bn in the quarter and €132bn over nine months, about 6.6% of the assets at the start of the year. Assets under management for third parties were €2.152tn at the end of September, up from €1.990tn at the end of 2025, even though rising interest rates lowered bond values in the quarter. Margins and performance fees at PIMCO also helped. Allianz used part of its capital to buy back PIMCO's M units this year, which strengthens its claim on the asset manager's profits.
Property and casualty insurance was solid despite the weather. The nine-month combined ratio was 92.2%, within the 92–93% target. In the third quarter, natural catastrophes cost 5.1 points of the loss ratio, against a normal budget of about 3 points, but strong reserve releases made up for most of it. Revenue in P&C rose 4.5%, with prices up 2.7% and volumes 1.6%. Price increases on renewals are slowing, especially in large corporate risks. Life and health insurance was stable, with new business up 4.2% and a slightly lower new business margin, while the contractual service margin, the store of future life profits, grew 3.4% in nine months.
Capital is strong. The Solvency II ratio was 219% at the end of September, 1 point higher than at the end of 2025, and Allianz completed its €2.5bn buyback in September. The ratio fell from June because of markets and the PIMCO transaction, but Allianz generates enough capital to keep returning more than its dividend. With P&C pricing past its peak, asset management is becoming the part of the group that drives earnings growth, and it is doing so at very high margins.
RTL Group (RRTL Germany): Sky and streaming carry a weak advertising market
● NEUTRAL
Small profit cut as TV ads fall; Sky and streaming offset.
Price 32.60 · P/E next yr 13.3x · Upside -3.8%
RTL lowered its 2026 profit target slightly, and the reason was linear television. Adjusted EBITA is now expected at about €700m, against €725m before, and revenue at about €7.1bn, the bottom of the previous range. TV advertising fell 8% in the third quarter, after a 4% decline in the first half, as both German and French TV markets contracted. Demand for the fourth quarter is lower than RTL expected. Group revenue rose 38% to €1.85bn in the quarter, but that was almost entirely Sky Deutschland, consolidated since June, which added about €1bn. Organic growth was 4.8%.
Streaming is the part that works. Paid subscriptions to RTL+ in Germany and Hungary and M6+ in France reached 9m at the end of September, up 18.4%, which is already the full-year target. Streaming revenue rose 27.9% to €449m over nine months, helped by price increases in Germany and by advertising. RTL confirmed a streaming EBITA of about €100m this year, after raising that target from €25–50m in the first half. Fremantle, the production arm, grew revenue 7.8% to €482m in the quarter thanks to the delivery of the series Kill Jackie, though it is still down 2.6% over nine months. Its 9% margin target was confirmed.
The cut is modest. €700m is still about 6% more than the €661m of 2025, even with seven months of Sky included, and CEO Clément Schwebig said EBITA also grew organically over nine months. The bigger question is the target of €1bn of adjusted EBITA in the medium term, about 43% above this year. The €250m of annual synergies from Sky Deutschland, expected within three years, would take RTL to about €950m on their own. The rest has to come from streaming and from linear TV not shrinking further. That is where the risk sits. Linear advertising is still the largest profit source, and it is now declining faster than in the first half without any sign of a turn. Sky brings scale in pay TV and sport, and with it high programming costs. RTL's plan makes sense, but it depends on delivering synergies while its core business is shrinking. The next twelve months of advertising data will show whether the €1bn target holds.
Intershop (ISN Switzerland): One sale triples the year's disposal gains
● POSITIVE
Basel sale shows conservative book values; earnings stay lumpy.
Price 163.00 · P/E next yr 17.3x · Upside 11.0%
Intershop has agreed to sell its Lehenmatt development in Basel, and a Swiss investment foundation will take ownership at the end of 2026. The deal covers two 17-storey residential towers and the neighbourhood shopping centre. The price was not disclosed, but the effect is clear. Intershop now expects pre-tax gains from property sales of CHF 90–95m this year, against its earlier guidance of at least CHF 30m. The gain from this one transaction is thus at least CHF 60m.
Lehenmatt shows how Intershop earns money. It bought the site in 2006, renovated 264 apartments without evicting tenants, added 68 new units and two residential blocks, rebuilt the shopping centre and obtained a sustainable building certificate. After twenty years of work, it sells a stabilised property at a large premium to its cost. The company's strategy is exactly this: buy properties with planning potential in strong regions, raise their value through development and sell them. Zurich accounts for 60% of the portfolio by value and the Lake Geneva region for 18%. The core properties show what that means in practice: Puls 5 in Zurich, with a target rent of CHF 10.3m, had a vacancy of 3.6% last year, the Mediacampus 0.7% and Centre St-Roch in Yverdon-les-Bains 1.3%.
The sale also restores financial room. At the end of June the portfolio was worth about CHF 1.9bn, the equity ratio was 56.5% and LTV 33.3%, up from 28.0% at the end of 2025 after acquisitions such as the Kemptthal site bought early this year. The Lehenmatt proceeds will bring leverage down again and give Intershop money for the next project. The cost is lower rental income from 2027, because a fully let residential property leaves the portfolio.
For shareholders the deal confirms two things. First, the book values in the portfolio are conservative: a gain of more than CHF 60m on one property is about 3% of the entire portfolio value. Second, Intershop's earnings will remain lumpy, because disposal gains, not rents, make the difference from year to year. Investors who accept that get a company with a long record of creating value in the most expensive property markets in Switzerland and a dividend that is well covered by this year's profits.
eDreams ODIGEO (EDR Spain): The investment year is going to plan
● POSITIVE
Heavy investment year is delivering what management promised.
Price 4.71 · P/E next yr 14.1x · Upside 34.8%
eDreams is in the middle of the most expensive year of its plan to 2030, and the second quarter shows the spending is producing what management promised. Revenue margin, the company's measure of net revenue, rose 5% to €179.3m in the three months to September, after a 4% decline in the first quarter. Prime revenue margin grew 10%. Cash revenue margin fell 2% to €174.5m, because more members now pay their annual subscription in monthly instalments, which delays cash without changing the value of the customer. Cash EBITDA fell 39% to €33.5m, and adjusted EBITDA 22% to €38.3m.
The cost increase is deliberate. Variable costs rose 15%, mainly for acquiring new members, and fixed costs 17%, as eDreams hired more technology staff. The company announced a year ago that this would be the year of maximum investment and temporarily lower profit. In the first quarter net profit fell to €0.2m from €13.6m. Prime members reached 8.2m at the end of September, up 6%, with 134,000 net additions in the quarter after 173,000 in the first.
The full-year targets are 8.5m members and €115m of Cash EBITDA. The membership target needs about 300,000 net additions in the second half, the same pace as the first half, even though growth slowed from the first quarter to the second. eDreams expects Cash EBITDA to grow again from the fourth quarter, when comparisons become easier and the members recruited this year start to renew. Prime already provides 77% of cash revenue margin and 90% of cash marginal profit, so the profitability of the business now depends almost entirely on how long subscribers stay.
The new products are giving early support to the plan. Rail bookings rose thirteenfold, and in Spain rail already brings in more than 10% of new members. The five new Prime markets, Argentina, Mexico, South Africa, the UAE and Poland, grew volumes 58%. The 2030 targets are 13m members and more than €270m of Cash EBITDA, which means growth of about a third a year from this year's €115m and 1.5m net additions a year from next year, two and a half times the current pace. That is a demanding acceleration, and the company will need to show it in the next two quarters before the market gives it much credit.
AmRest (EAT Poland): Czechia is still a problem
● NEGATIVE
Slow growth, lower margins and Czechia still weighing on results.
Price 9.06 · P/E next yr 29.3x · Upside -0.3%
AmRest's third quarter showed a business that is growing slowly and earning less on each euro. Revenue rose 1.2% to €668.4m, EBITDA fell to €105.6m from €111.2m, and the margin dropped a point to 15.8%. The group even reported a net loss of €1.5m, partly because of an €8.1m accounting charge for the refinancing of its syndicated loan and partly because of exchange rate losses. The refinancing itself is good news: it extends the maturity to June 2031, adds up to €100m to the revolving credit line and lowers the margin.
Central and Eastern Europe, almost two thirds of sales, explains most of the decline. Revenue there grew 1.8% to €428.8m, but EBITDA fell 5.7% to €81.2m. The Czech Republic was the cause. A reputational crisis in the local business hurt traffic, revenue fell 10.1% and EBITDA nearly halved, with the margin down from 20.7% to 12.7%. Sales had not recovered to last year's level by the end of the quarter. Hungary was the bright spot, with revenue up 14.5% and EBITDA up 17.5%, while Poland, the largest market, was flat.
Western Europe was weak as well. Revenue there fell 0.5% to €218.2m and EBITDA 3.6% to €31.0m. Germany is the main concern: revenue was flat but EBITDA fell 13.3%, a margin of 13.2%, because the cost base is too high for current sales. France is still barely profitable at a 4.8% margin, while Spain remains the reliable earner with a margin of 20.9%. Management pointed to weak consumer sentiment in both Germany and France. China, a small business with 83 restaurants, grew.
Cash flow is better. Operating cash flow rose to €278.9m over nine months, investments were lower, and net debt fell by €19.1m to €499.2m, about 2.5x EBITDA. Over nine months, EBITDA was €283.4m, a margin of 14.9%, and the net loss €14.9m. AmRest opened 44 restaurants in nine months, 31 of them in Central and Eastern Europe, and will open its first four Taco Bell restaurants in Poland this quarter. But a group that owns 2,136 restaurants in 22 countries needs like-for-like sales growth to lift margins, and with sales almost flat across the network, there is little sign of that in the near term.
Soitec (SOI France): Photonics is taking over
● POSITIVE
Photonics doubling now drives the business, and the volatility.
Price 98.16 · P/E next yr 103.2x · Upside 76.7%
Soitec reports its half-year figures on Wednesday, and the revenue side is largely known. Management guided for organic growth of more than 30% in the second quarter, after 23% in the first, when photonics revenue doubled. The fiscal year started badly elsewhere: Mobile Communications fell 10% in the first quarter because of an inventory correction among RF customers, and Automotive & Industrial is growing from a very low base. Last year revenue fell 30% organically to €592m and the EBITDA margin dropped to 25.4%.
Photonics-SOI is changing the company. These wafers go into optical transceivers that connect servers in AI data centres. Revenue was slightly above $100m last year, and Soitec expects it to more than double this year. Customers sign multi-year capacity reservation agreements and pay cash deposits, and the 300mm fab in Singapore is qualified for high-volume production. CEO Laurent Rémont, in office since April, said "visibility on Photonics-SOI is now good". Edge & Cloud AI, which includes photonics, already accounts for more than half of revenue.
The balance sheet is in better shape than the share price swings suggest. Last year free cash flow was a positive €63m despite the drop in revenue, and net debt was only €56m, 0.4x EBITDA, with €562m of cash. Soitec also signed a long-term POI agreement with Skyworks in mobile and a 300mm power-SOI collaboration with ZenSemi in June, so the other divisions have new products waiting for their markets to recover.
The margin is the question for Wednesday. Last year's 25.4% suffered from low fab utilisation, and this year Soitec faces lower subsidies and a weaker dollar. It has hedged about 95% of its exposure at €1.19 per dollar. Better utilisation and the photonics mix should push the other way. Cash flow should be healthy, helped by lower inventories, limited capital spending of about €100m for the year and customer prepayments.
The share price has swung enormously over the past twelve months, with the high almost nine times the low. Soitec still gives only quarterly revenue guidance, and with demand this much easier to forecast it could do more. A full-year figure, or a first roadmap from the new CEO, would help to reduce that volatility. Until then the stock will trade on every headline about AI spending, because photonics now decides the value of Soitec.
Brenntag (BNR Germany): Undoing the split
● POSITIVE
New management reverses the split with a cost-led, credible plan.
Price 57.34 · P/E next yr 14.4x · Upside 2.8%
Brenntag's new management has reversed the central plan of its predecessors. The company had separated into two divisions, Essentials for basic chemicals and Specialties for higher-value products. Activist PrimeStone, backed by Engine Capital, campaigned in 2023 to go further and split the company in two, and won seats on the supervisory board. CEO Jens Birgersson now puts the two businesses back together into one platform. "We are not dismantling what we built. We are connecting it and scaling it," he said. The about 4,000 salespeople will again sell the whole portfolio, organised by customer instead of product.
The separation cost Brenntag customers. More than 10% of smaller customers were lost, and many who used to buy from both divisions ended up buying from only one. The split was also hard to execute because Brenntag's IT systems were never properly integrated, which is the backbone of a distribution business. Winning back these customers, cross-selling and a harmonised pricing framework based on Brenntag's own data should add €1.7bn of sales. A separate program of procurement, network, supply chain and overhead measures should add about €450m to EBITDA.
The targets are an operating EBITDA margin of about 10% in the medium term, organic growth one point above the market, ROIC above 12% and leverage of 2.0–2.5x. On 2025 sales of €15.2bn plus the €1.7bn, 10% means EBITDA of about €1.7bn. Brenntag says this year's normalised EBITDA is about €1.3bn, after removing about €150m of extra profit from shortages caused by the Middle East crisis. The gap of about €400m is smaller than the €450m of planned savings, so the target leaves room for some price pressure and cost inflation.
The plan is credible because it relies on cost measures and on reversing a self-inflicted loss of customers, not on a market recovery. M&A of about €1.5bn over the medium term, capex of €300–400m a year and an unchanged payout of 35–50% of net income complete it. Brenntag spent only €155m on acquisitions last year, so the budget allows a clear step up once the new structure is in place. The shares trade at a clear discount to their own history and to peers on EBITDA, which seems too low for a market leader with a plausible route to a 10% margin. The risk is execution: undoing a reorganisation costs time and management attention.
MLP (MLP Germany): Record profit with room to spare
● POSITIVE
Record profits growing far faster than revenue.
Price 11.64 · P/E next yr 15.4x · Upside 17.0%
MLP had the best third quarter in its history. EBIT rose 45% to €26.7m, and over nine months revenue grew 12% to a record €863.0m while EBIT increased 43% to €87.1m. The EBIT margin rose 220bp to 10.1%. Net profit was up 32% at €58.8m, and third-quarter EBIT of €26.7m was the highest the company has reported for that quarter. Cost control did much of the work, because revenue growth was spread widely while expenses rose much more slowly.
Wealth management is the largest driver. Revenue in that area rose 16% to €431.5m, now half of the group, and assets under management reached a record €70.1bn, up from €65.9bn at the end of 2025. Property and casualty insurance grew 11% to €197.4m, with gains among both corporate and private clients, and managed non-life premiums rose to €870m from €809m. Life and health insurance was stable at €199.4m. Assets under management grew 6.4% in nine months and managed non-life premiums 7.5%, and both feed into revenue in the following quarters. Growing assets and premium volumes make more of the revenue recurring, so earnings depend less on new contracts.
The guidance looks safe. MLP recently raised its 2026 EBIT target to €110–120m, which after nine months requires €22.9–32.9m in the fourth quarter, the strongest quarter of the year. The lower end is below the third-quarter result. For 2028 the company targets revenue of €1.3–1.4bn and EBIT of €140–155m, 22–35% more than the midpoint of this year's range. Growth should come from family clients, corporate clients and multi-asset products for institutional and wealthy clients at FERI. That means more of the same: the plan is an extension of what is working now, and it does not need an acquisition or a new business line.
The weak point is the part of the profit that depends on financial markets. Performance fees at FERI and the value of assets under management move with markets, and a weak year would hit both. Management says the 2028 plan assumes little from performance fees, which limits that risk. With profits growing much faster than revenue and a plan that does not rely on strong markets, MLP has become a more solid business than its share price history suggests.
Técnicas Reunidas (TRE Spain): The dividend is back
● POSITIVE
Net cash funds a dividend and buyback; Middle East concentration remains.
Price 31.22 · P/E next yr 14.0x · Upside 30.1%
Técnicas Reunidas has resumed dividend payments for the first time since its difficult years, with an interim payment of €21m in January 2027, and started a €50m share buyback in September. It can afford both. Net cash rose to €628m at the end of September, from €344m in June, partly because of customer advances on large contracts. Nine-month revenue grew 4% to €4,794m and net profit 10% to €119m. Executive chairman Juan Lladó says the record backlog gives "exceptional visibility for the coming years".
Profitability is the main improvement. Third-quarter EBIT was €98m, 17% more than a year earlier, a margin of 5.7% against 4.5%. Over nine months reported EBIT was €203m, a margin of 4.2%, after a €45m charge in the first quarter related to the conflict in the Middle East. Without that charge EBIT was €248m, up 21%, and the underlying margin has improved for six quarters in a row. The company says project execution in the region continues normally and expects no further provisions.
The full-year targets are revenue above €6.5bn and EBIT of about €295m, raised from €280m. That implies fourth-quarter revenue of at least €1.7bn and EBIT of about €92m, slightly lower than the third quarter. The backlog stands at a record €14.1bn, 34% higher than at the end of 2025, after €7.55bn of new orders this year, more than two years of revenue. Orders in nine months alone exceeded the full-year revenue target. New contracts include the Upper Zakum and Dorra projects in the Middle East, the Greenlight combined-cycle power plant in North America, the Coastal GasLink extension in Canada and decarbonisation work for ArcelorMittal in France.
The concentration is the risk. A large part of the backlog is in the Middle East, and big new contracts such as Upper Zakum start with years of engineering and procurement before construction brings most of the revenue. That makes the next two years less certain than the backlog figure suggests. The more than €2bn of orders outside the region, mainly in North America through TR Power and services, are the right step towards balance. A dividend from a company that had to be rescued by the state during the pandemic is a clear sign of how far it has come.
Ströer (SAX Germany): Digital screens are not enough yet
● NEGATIVE
Flat EBITDA; digital screens cannot yet offset weak outdoor.
Price 38.42 · P/E next yr 13.5x · Upside 26.0%
Ströer's third quarter was in line with its plan, but it showed again how much of the group depends on outdoor advertising. Revenue rose 4.4% to €513.0m, organic growth was only 0.8%, and adjusted EBITDA was flat at €147.8m. Digital out-of-home grew 11% to €102.5m, and programmatic sales within it rose 21%. Classic posters fell 4.4% to €126.0m, as advertisers move to screens. The outdoor segment as a whole grew 3.6%, but its EBITDA fell 2.4% and the margin dropped to 45.5%.
The rest of the group has mixed fortunes. Dialog, the call centre and door-to-door sales business, grew 30.4% partly through acquisitions, and its EBITDA rose 19%. Statista, the data platform, lost revenue because many small customers left. Customers paying more than €20,000 a year now make up 48% of revenue, against about 30% a year ago, but management expects "an ongoing bleeding for the next 12 to 18 months". Asam, the beauty products company, lost 20% of revenue, and Ströer says it is not a long-term asset. The DaaS & E-Commerce segment's EBITDA fell 44% to €5.7m.
Cash is the weak point. Adjusted free cash flow after lease payments was only €5.0m over nine months, against €19m a year earlier, while Ströer paid €102m in dividends and €23.5m for buybacks. Net debt rose to €1,015m and leverage to 2.66x from 2.31x at the end of 2025. €230m of debt matures in June 2027. The company has a restructuring program aimed at becoming "AI-native", with job cuts at Statista, Asam and in IT, but the savings arrive only from the second half of 2027.
The guidance for low to mid single-digit organic growth, stable EBITDA and better free cash flow was confirmed, with the fourth quarter called "decisive". Management says outdoor bookings are strong and early talks with agencies for 2027 are encouraging. The comparison helps, because the fourth quarter of 2025 was weak, with revenue of €603.3m and adjusted EBITDA of €212.3m. New products should support pricing as well: Ströer now sells 14 large screens as a single Iconic Screen Collection, and the first meaningful orders from AI companies are expected this quarter. The outdoor business is attractive and would interest buyers, but management denies that a private equity deal is close. Until it simplifies the group, Ströer's cash flow will keep being diluted by businesses that have nothing to do with its best one.
Sonova (SOON Switzerland): Taking share from a faster market
● POSITIVE
Wholesale keeps taking share; cochlear implants remain the weak spot.
Price 287.80 · P/E next yr 25.1x · Upside -4.7%
Sonova's first-half figures were covered here last week, and the call added some useful detail. Wholesale hearing aid sales grew 11.0% in local currencies, almost exactly the 10.9% of the previous half, so the growth has held at this level for a full year. With the market growing 3–5%, Sonova is taking roughly 6 to 8 points of share each year in its manufacturing business. Volumes and average prices both rose, with Virto R and Infinio Ultra selling well and the recent update of the EON platform well received. North America and Asia Pacific contributed most.
Retail shows a different pattern. Organic growth of 5.2% is above the market but tied to it, and acquisitions added 1.3 points in the half. Management indicated that it will step up buying independent hearing care shops, so external growth will contribute more from here. This is a sensible use of capital after the sale of the Sennheiser consumer business, because Sonova can then sell its own devices through more of its own shops.
Cochlear implants remain the weak spot, with an organic decline of 10.2% in the half on pressure in China and the US. The new Integro implant, which uses technology from Phonak hearing aids, should help sales recover in the second half. That is the most important open point for the full year, because the division's decline offsets part of the gains elsewhere. The profit upgrade already includes higher strategic investments in the low double-digit range. The overall picture is of a group that is executing well in a market that has improved. That is already reflected in a premium rating, so further gains in the shares will depend on whether Sonova can keep taking share at this rate for another year.
Merlin Properties (MRL Spain): The data centres are starting to pay
● POSITIVE
Second FFO upgrade as the data centres start to contribute.
Price 11.58 · P/E next yr 21.4x · Upside 44.8%
Merlin has raised its 2026 guidance for the second time in four months. In July it pointed to FFO of around €0.55 per share; it now expects €0.58, about 5% more. After nine months the company had booked €0.44, so the new figure only needs €0.14 in the fourth quarter, slightly below the average of the first three. In euros, FFO rose 11.9% to €274.5m and revenue 12.9% to €466.2m. Per share the increase was a modest 1.7%, because the March capital increase to fund phase III of the data centre plan spread the profit over more shares.
The traditional portfolio is in good shape. Like-for-like rents rose 3.4% over nine months and occupancy reached 95.0%. Shopping centres did best: like-for-like rents rose 7.1%, tenant sales grew 9.7% and occupancy reached 97.2%, with an occupancy cost ratio of 10.7% that leaves room for further rent increases. Logistics picked up during the year, and offices, still half of gross rents, grew 2.3% on indexation and slightly positive renewals.
The data centres are where the numbers start to move. Phase I, 64 MW of IT capacity, is fully equipped and let. It brought in €46.5m of rent over nine months and should produce about €68m this year and €97m at full capacity in 2027, so another 40% or more is already contracted. Across the whole plan, 160 MW is let and another 206 MW is in advanced negotiations. The three phases now add up to 704 MW, slightly less than before, for a total investment of €7.7bn and stabilised rental income of €1.1bn from 2031.
To put that in context, the group as a whole now generates about €620m of revenue a year, so Merlin is building a second company larger than the first.
Funding this looks manageable. The €3.75bn refinancing completed at the end of October pushed the average debt maturity from 3.7 to 5.3 years and removed all maturities for the next three years, and LTV was 24.9% at the end of June. The board approved an interim dividend of €0.20 per share. The main open question is regulatory. Spain is preparing a decree on data centres, and the general election on 29 November could change its direction. Merlin's growth over the next five years depends far more on that decree than on Madrid office rents, and investors should weigh it accordingly.
Dassault Systèmes (DSY France): Lower 2029 targets, but more believable
● NEUTRAL
Lower 2029 targets are more realistic, but leave gaps.
Price 25 · P/E next yr 18.7x · Upside -0.3%
Dassault Systèmes has lowered its 2029 targets, as most investors expected. It now aims for revenue above €8bn and non-IFRS earnings per share of €1.80. In June 2025 it had already pushed its targets back a year and was then aiming for €2.20 of EPS in 2029, excluding large acquisitions. The new figure is about 18% lower. The company also expects double-digit growth in revenue and EPS in 2029 itself and operating cash flow of about €2.5bn.
The arithmetic shows how the plan is built. This year Dassault expects revenue of €6.40–6.46bn, growth of 4–5%, after raising its guidance with the third-quarter results. Reaching €8bn in 2029 requires about 7.5% a year. If 2029 grows 10%, as the target implies, 2027 and 2028 only need about 6% a year. That is a little faster than now, but the real acceleration is pushed to the end of the period. Investors have seen this pattern from Dassault before, one reason the shares have fallen so far.
The growth engines are clear. Subscriptions now make up half of recurring revenue, and subscription ARR grows at over twice the rate of total ARR, which rose 6% in the third quarter. 3DEXPERIENCE software revenue rose 25% and cloud revenue 14%. Life Sciences, where Medidata struggled for years, now has a single operating model and new leadership under Ashwini Zenooz, and the acquisition of ArisGlobal has closed. Dassault also plans usage-based pricing for the work done by its AI assistants, on top of traditional licences per seat. CEO Pascal Daloz put the case for industrial AI simply: "In industry, almost right is wrong."
What is missing is as telling as what is there. There is no margin target, no ARR guidance for 2027–2028 and no new buyback, even though the operating margin is above 32% and operating cash flow is about €2.5bn a year. A move to subscriptions usually depresses revenue for a few years before it pays off, and that seems to be what Dassault is now admitting. The new plan is more realistic than the old one. The shares will probably need evidence of faster growth in 2027 before they move on 2029 ambitions.
INDUS (INH Germany): The tungsten windfall ends this quarter
● NEGATIVE
Tungsten windfall makes 2026 a peak year that will be hard to repeat.
Price 34.55 · P/E next yr 6.5x · Upside 24.9%
INDUS had a remarkable third quarter. Revenue rose almost 24% to €544.3m and adjusted EBITA nearly doubled to about €95m, against €48.1m a year earlier. Over nine months adjusted EBITA reached €218.5m, more than twice the €104.2m of 2025, and the margin rose from 8.2% to 14.5%. Almost all of it came from one place. BETEK, the largest holding, makes wear parts with tungsten carbide, and Chinese export restrictions sent prices for the material to record highs. Materials Solutions grew revenue 38.6% to €584.7m at a 24.4% nine-month margin. A year ago the same division was spending money to secure feedstock when deliveries from China stalled.
The full-year guidance tells the rest. INDUS kept its targets of €220–260m adjusted EBITA on revenue of €1.9–2.1bn. With €218.5m already booked, that implies fourth-quarter EBITA of between €1.5m and €41.5m. Even the top of the range is less than half of the third quarter. The Materials Solutions margin target was raised to 18–20% for the year, which also means a sharp drop in the last quarter after 24.4% in the first nine months. The company says tungsten prices have fallen in China, customers are holding back and Chinese exporters are now selling finished products that use the cheaper domestic metal.
Below the headline, the picture is less strong. Net profit attributable to shareholders rose only 22% in the third quarter, to €40.5m, because INDUS booked about €19m of impairments, mostly at three Engineering companies whose prospects changed. Nine-month impairments were €20.1m, against €1.4m a year earlier. Engineering reached record revenue of €432.9m but its margin fell to 6.6%, and its full-year margin range was cut to 8–10%. Free cash flow was €38.0m after nine months, below last year's €58.7m, because the expensive tungsten tied up working capital.
There is a positive side. Orders rose 14.8% to €1.64bn and the backlog was 20.4% higher than at the end of 2025, so the rest of the portfolio is not shrinking, and working capital should return as tungsten prices fall. But 2026 will be a peak year, and 2027 starts from an earnings base that included a commodity windfall. The share price had risen by about a quarter this year before the results. That is a lot of credit for a profit level that the company itself does not expect to repeat in the fourth quarter.
Bastide (BLC France): Paying a dividend again after five years of repair
● POSITIVE
Seven percent organic growth and a dividend after years of repair.
Price 19.40 · P/E next yr 8.8x · Upside 39.2%
Bastide started its financial year with organic growth of 7.1%, to €124m in the first quarter. The comparison needs some care, because the group sold Experf in June and last year's €115.6m is the restated figure without it. Respiratory care was again the strongest business, with organic growth of 6.8% even though prices for sleep apnoea devices were cut. Volume gains and market share more than made up for it. Homecare, Bastide's largest activity at €52m, grew 6.2%, faster than its 5.2% of last year. Nutrition, infusion and stomatherapy slowed to 4.7% after the divestment. Last year the group earned EBITDA of €107.9m, a margin of 22.4%, and a current operating margin of 9.2%, slightly above its own 9.0% target.
The most telling news was the dividend of €0.47 per share to be proposed at the AGM. Bastide has paid nothing for five years while it worked down its debt, and the balance sheet now allows it. Net financial debt was €250.9m at the end of June, €134.7m lower than a year earlier, and leverage fell from 3.41x to 2.37x EBITDA, well below the 4.25x covenant. The sales of Baywater and Experf brought in €110m, and operating free cash flow rose by €16m to €38.4m. The disposal program is now largely complete.
For 2026-27, management targets revenue of at least €500m and a stable current operating margin of 9.2%. That is less ambitious than it looks. The base year's €482.4m still included Experf, so the target requires only about 4% growth on that reported figure, while the remaining businesses are growing 7% organically. Lower debt should cut financing costs by about €2m. So earnings per share should grow faster than revenue even with a flat margin. The constraint is the customer. About three quarters of revenue comes from France, much of it paid for by the national health insurance system, which needs savings and has already cut device prices. Bastide does not expect further major price cuts this year, but that is the risk on which the valuation rests. The shares are priced as if growth will be absent, which seems too harsh for a company growing organically at 7% that has just reached the point where it can reward shareholders again.
GEA (G1A Germany): Klebert leaves at the top
● NEUTRAL
CEO exit hit the shares harder than the strategy warrants.
Price 68.90 · P/E next yr 20.8x · Upside 6.1%
GEA announced that CEO Stefan Klebert will step down after the AGM on 29 April 2027, at his own request. The timing is a surprise. Barely a year ago, in October 2025, the supervisory board extended his contract early until the end of 2028, and in the same decision restructured the executive board from three to six members. Klebert has run GEA since February 2019, and in that period the company moved into the DAX and became one of the most profitable equipment makers in Europe.
The latest quarter shows the state he leaves it in. Orders rose 20.3% to €1,650.7m in the third quarter, revenue grew 7.0% to €1,461.2m, and EBITDA before restructuring increased 12.6% to €260.9m, a record quarterly margin of 17.9%. ROCE reached 37.8%. Service is now 40.9% of revenue. Net liquidity was €115.2m at the end of September, after €54.1m of buybacks in the quarter. Pharma is the newest growth area: continuous tableting won a large order, and GEA expects that business to grow 15–20% a year until 2030. The guidance for 2026 is organic growth of 6–8% and a margin of 17.0–17.4%, and the Mission 30 strategy is delivering on most fronts.
The successor comes from inside. Klaus Stojentin, 59, has been with GEA since 2003 and has run several of its businesses, among them Separation & Flow Technologies, the separator business that is the core of GEA's profits, and since January Nutrition Plant Engineering, which merged the liquid and powder technologies with refrigeration solutions in the 2025 reorganisation. That division booked €191.7m of large orders in the third quarter alone. Andreas Seeringer, head of Farm Technologies, takes over NPE. GEA has not had to search for anyone, and the new CEO helped design the current structure.
The shares lost about €650m of market value on the day, which is an understandable reaction to losing a CEO with Klebert's record. But it also seems excessive. The strategy runs to 2030, the targets were set by a board that includes Stojentin, and the businesses he ran are among the strongest in the group. The bigger risk is that he is largely unknown to investors and will have to prove that he can keep the cost discipline that drove the margin, at a time when orders are growing fast and the temptation to add capacity increases.
freenet (FNTN Germany): The Telefónica question is almost settled
● NEUTRAL
Telefónica issue nearly settled, but mobile ARPU keeps falling.
Price 24.64 · P/E next yr 12.1x · Upside 8.3%
freenet's nine-month figures show a business holding steady at the core while the headline numbers move with acquisitions. Revenue rose 25.2% to €2,289.6m, mainly because mobilezone Deutschland is now consolidated. Postpaid service revenue grew only 0.9%, because average revenue per user fell 5.1% to €16.60. Adjusted EBITDA dropped 5.7% to €372.5m, with the mobile segment down 10.6%. About €32m of that decline came from a commercial agreement with Telefónica Deutschland, which will cost around €50m this year. Free cash flow still rose 2.7% to €233.3m, and cash conversion improved to 62.7%.
The guidance of €500–530m adjusted EBITDA implies a fourth quarter of €127.5–157.5m, against an average of €124m in the first three. The company has been clear that the year is back-loaded, but the bottom of the range already requires an improvement. The most important event came after the quarter: on 10 November freenet and Telefónica signed a term sheet for a long-term continuation of their cooperation. The terms have not been published. Until they are, nobody outside the two companies knows whether freenet bought security at the price of a lower margin.
The TV business is the part that grows. waipu.tv added 116,000 subscribers this year to reach 1.871m, and IPTV EBITDA rose 20.3% to €29.5m over nine months. In October freenet bought the remaining 25% of Exaring, the company behind waipu.tv, for €76m upfront plus up to €50m if growth is very strong, which values the whole business at about €300m. With IPTV EBITDA guided at €45–55m this year, that is roughly 6x, a fair price for a platform with an estimated 20–25% share of German IPTV that freenet now owns outright.
The 2028 target of more than €620m EBITDA requires growth of 17–24% from this year's guidance, or roughly 6–7% a year. TV and cost savings can deliver part of that, but mobile has to stop shrinking, and that depends on the Telefónica terms and on ARPU, which is still falling. For 2025 freenet paid €2.07 per share. In the meantime, the minimum dividend of €2.00 per share for 2026–2028, or 80% of free cash flow if higher, carries the shares. Income investors get paid to wait, but the upside depends on details freenet has not yet disclosed.
Richemont (CFR Switzerland): Slower growth, better margins
● POSITIVE
Growth slowing from a high level while margins improve, watches included.
Price 176.15 · P/E next yr 25.2x · Upside 19.3%
Richemont's first half was strong in every respect except the pace of growth, which is slowing from a very high level. Sales rose 17% at constant rates to €12,282m, with the first quarter up 20% and the second 13%. Operating profit increased 33% to €3,129m, a margin of 25.5%. That figure includes €229m of one-off tariff reimbursements, about 7% of the total, but without them operating profit was still €2.9bn, about 23% more than a year earlier, at a margin of 23.6%.
Net profit rose 39% to €2,528m and net cash stood at €7.7bn after the dividend, while operating cash flow rose 35% to €2.5bn.
Growth came from the right places. The Americas rose 23% and Japan 30% at constant rates, Europe 13% and Asia Pacific 16%, where South Korea and Hong Kong made up for a slightly weaker mainland China. Only the Middle East fell, by 2%, because the conflict in the region hit tourist spending in the UAE. Retail, now 72% of sales, grew 20% at constant rates, and the share of sales direct to clients reached 78%. More control over the channel means more control over pricing.
The Jewellery Maisons remain the engine. Sales rose 19% at constant rates and operating profit increased from €2.5bn to €3.2bn, a 35.3% margin, or 33.4% without the reimbursements. Volumes grew across all price levels, and newer lines are growing alongside icons such as Love and Alhambra. Gold is the cost to watch. Without tariff items the group gross margin fell 70bp, as higher raw material prices were only partly covered by price increases. The company calls its pricing disciplined, which in practice means Cartier and Van Cleef & Arpels are absorbing some of the gold price instead of passing it all on.
The surprise was in watches. Specialist Watchmakers grew 10% at constant rates to €1.7bn, and operating profit tripled from €50m to €150m, a margin of 8.8%. Vacheron Constantin and A. Lange & Söhne are doing well at the top end, and Jaeger-LeCoultre accelerated. Rupert warned that the recovery will not be linear, and at under 9% the margin is still a long way from where it was before the downturn. But the division is no longer a drag, and with jewellery margins above 33% even after one-offs, Richemont is earning more per euro of sales while growth slows, which is the best possible way for a luxury company to slow down.
ASTA Energy Solutions (ASTA Austria): The guidance leaves room
● VERY POSITIVE
Nine-month EBITDA already beats 2025; guidance looks conservative.
Price 47.80 · P/E next yr 20.8x · Upside 60.4%
ASTA, the Austrian maker of copper conductors for transformers and generators that listed earlier this year, has already earned more after nine months than in all of 2025. Adjusted EBITDA rose 39.3% to €51.0m, against €48.6m for the whole of last year, and the margin improved to 7.9% from 7.0%. Revenue grew 23.3% to €649.0m, partly because copper prices rose, and net-value sales, which strip out the metal, grew 30.6% to €144.6m. Net profit doubled to €32.9m. In the third quarter, EBITDA was €14m on net-value sales of €46.3m, a margin of about 30% on that measure.
The confirmed full-year targets look easy to reach. ASTA expects revenue above €790m, net-value sales of at least €170m and adjusted EBITDA of €60–64m. That leaves €9–13m of EBITDA for the fourth quarter, against €12.0m in the fourth quarter of 2025 and €14m in the third quarter, and only €25.4m of net-value sales, little more than half the third quarter. The fourth quarter is the seasonal low because factories shut for maintenance, but even so the lower end of the range would mean a weaker quarter than a year ago.
The balance sheet has changed completely since the IPO. Net debt of €56.6m at the end of 2025 has turned into net cash of €62.9m, and the equity ratio rose from 24.9% to 46.4%. After the quarter, ASTA repaid €36.2m of loans, including interest, to related companies, which removes a link that investors in a newly listed company tend to dislike. Operating cash flow more than doubled to €31.5m.
The growth plan is in place. The expansion in China is complete, the new plant in Bosnia should open at the end of November, and ASTA approved about €17m for a copper recycling plant in Oed, Austria, from 2029. In the US it signed its first long-term supply contract, with Virginia Transformer Corporation, running to 2029, and will open a sales office in the first quarter of 2027. Customers will be supplied from the existing plants, and a US factory, possibly through an acquisition, remains an option for later. That is a cautious approach in a market where transformer demand is strong but tariffs make it risky to build too fast.
Deutsche Pfandbriefbank (PBB Germany): Back in profit, but only just
● NEGATIVE
Back in profit thanks to provisions; 2028 targets look far away.
Price 2.64 · P/E next yr 67.4x · Upside 17.2%
PBB is profitable again, but only by a small margin. Over nine months, pre-tax profit was €28m, after a loss of €235m a year earlier, and net profit came to €27m, or €0.06 per share. The improvement came almost entirely from provisions. Risk costs fell to €32m from €356m, now that the run-off of the US commercial property portfolio is largely behind it. Operating income moved the other way, falling to €266m from €316m, because the loan book keeps shrinking in a weak property market.
The full-year guidance of €30–40m pre-tax profit was confirmed, but PBB now expects the lower end. That leaves between €2m and €12m for the fourth quarter. New business also pointed to the bottom of its range: €4.5bn was signed in nine months, 14% more than a year earlier, and the full-year figure of about €7.5bn requires €3bn in the fourth quarter alone. The bank also lowered its target for assets under management to €2.9–3.1bn, citing slow transaction markets. Each of these adjustments is small, but together they show a bank that has stopped shrinking without yet starting to grow.
There is real progress in the details. Costs are under control, the cost-income ratio improved to 70% in the third quarter, and the CET1 ratio of 14.1% is comfortable against the bank's target of at least 13%. Liquidity is no longer a concern, and the bank has raised €2.3bn in funding this year. The new Deutsche Investment platform is starting to bring in commission income, which PBB needs to become less dependent on interest margins in commercial real estate.
The difficulty is the distance to the targets. PBB still aims for a pre-tax return on tangible equity of 8% by 2028, against 0.5% in the first nine months of this year. Getting there requires higher lending volumes, better margins, more fee income and a much lower cost-income ratio, all at once, in a market where clients are still postponing decisions. Activist Petrus Advisers complained in 2023 that the bank earned less than its cost of capital, and three years later that remains true. The shares have fallen by about a third this year, which already prices in a lot of doubt, but there is little reason yet to bet on the 2028 plan.
Gerard Perrier Industrie (GPE France): Defence is now a growth engine
● POSITIVE
Defence and nuclear drive growth above the company's own targets.
Price 74.20 · P/E next yr 14.4x · Upside 34.8%
Gerard Perrier Industrie keeps growing faster than its own targets suggest. Third-quarter revenue rose 14.1% to €90.5m, and nine-month revenue reached €264.8m, up 11.6%. About 5 points came from organic growth and the rest from acquisitions, mainly AQLE, which has been part of the group for the whole year, and Ofatec, consolidated for seven months. Management kept its full-year target of about €350m, which implies fourth-quarter revenue of roughly €85m, less than in the third quarter. It already raised that target once, from €345m, in September.
The mix of the business is changing. Aerospace & Defence, built around AECE and the acquired AQLE, grew 27% and is now the fastest-growing part of the group. GPI agreed in November 2025 to buy AQLE and the two Somalec companies for their expertise in complex electronic systems for aerospace and defence customers. Installation and maintenance, the largest activity, grew 13.6%, and manufacturing of electrical and electronic equipment rose 10.3%. Only the nuclear-related Energy activity was flat, up 1.8%, because EDF scheduled fewer reactor outages, when most of GPI's maintenance work takes place. That is timing, not a lost market.
The group is profitable and financially strong. In the first half, operating profit rose 20.9% to €11.0m, a margin of 6.2%, and net profit increased 16% to €7.9m. At the end of June the company had €80.5m of cash against €53.4m of financial debt, after paying an €8.7m dividend, so it has room for further acquisitions without stretching the balance sheet. It also holds 5% of its own capital in treasury shares. Management expects Aerospace & Defence to grow 18–20% for the full year, less than the 27% of the first nine months, and Energy only 1–2%, so the fourth-quarter target already assumes slower growth in the two areas where it is easiest to predict.
GPI moved its listing to Euronext Growth in September, which lowers its reporting burden but will not make it better known among investors. That is a shame, because the business has a lot going for it: exposure to defence and nuclear maintenance, two markets with long-term budgets behind them, a history of small, well-integrated acquisitions and a conservative management that rarely promises more than it delivers. The fourth-quarter target looks easily beatable.
Sixt (SIX2 Germany): The fleet is doing the growing
● POSITIVE
Fleet growth carries revenue; residual value risk mostly sits elsewhere.
Price 72.45 · P/E next yr 10.3x · Upside 29.6%
Sixt has already reported its third-quarter figures, and the call added detail on how the growth is achieved. The average fleet grew 11.4% to 248,300 vehicles, almost exactly in line with revenue, which rose 11.8% to €1,480m. Revenue per vehicle was therefore roughly €5,960 in the quarter, the same as a year earlier. Sixt is not getting more out of each car. It is growing by adding cars and branches, and the expansion around the Mediterranean, where Sixt now runs 359 branches across France, Italy and Spain after nine openings this year, is a large part of that.
That model has costs. Fleet operating expenses rose 25.1%, or €71.9m, more than twice as fast as revenue, because of registration fees, taxes, insurance and fuel. Other operating costs, which include leasing and technology investments, added €46.0m. As a result the EBT margin in the peak quarter fell 50bp to 19.0%. The network does bring something extra, though. Revenue from North American customers renting in Europe outside Germany grew 20%, which shows that the US expansion feeds the European business.
The risk is the value of the cars at the end of their use. Buyback or leasing agreements cover 83% of the vehicles added this year, so most of the residual value risk sits with manufacturers and lessors. That protection is worth more now that car prices are volatile and Chinese brands are pushing into Europe. Liquidity is ample, with a €1.55bn credit line fully undrawn at the end of September. The guidance of around €4.7bn revenue and an EBT margin of about 10% for the year stands. For next year, the question is whether Sixt can lift revenue per vehicle again, through pricing or higher utilisation, instead of relying on fleet growth that eats into the margin. Management mentioned high utilisation but gave no figures, and that is the number to ask for in March.
Uniper (UN01 Germany): Most of the growth comes next year
● NEUTRAL
Most of the earnings growth arrives in 2027; gas risk returns partly.
Upside n.m.
Uniper used its capital markets day to show what the company looks like now that the gas crisis is over. For 2027 it guides for adjusted EBITDA of €1.2–1.5bn and adjusted net profit of €550–750m, against €1.1–1.3bn and €550–650m expected this year and €1.1bn of EBITDA in 2025. The medium-term target is €1.2–1.6bn. Compare the midpoints and almost all of the growth arrives in 2027: €1.35bn next year, €1.4bn after that. Uniper is presenting a stable earnings level, and from that level a dividend that should grow 7% a year from the proposed 2026 payment of €321m, about half of this year's expected net profit.
The mix of earnings is shifting. Green Generation, which includes Swedish hydro and nuclear, should recover next year if there are no unusual outages, and is targeted at €600–800m in the medium term. Flexible Generation, the gas and other dispatchable plants, should improve as data centres need more firm power and as UK capacity payments rise, with a target of €200–500m. Greener Commodities, the gas trading and supply business, will shrink as midstream gas results return to normal, to €300–500m. Uniper wants at least €500m of EBITDA from activities that do not depend directly on market prices, against less than that today, so a larger part of profit should become predictable.
The investment plan is large for the size of the company. About €6bn of growth capex is planned to the early 2030s, more than four years of current EBITDA, plus about €3bn for maintenance, and €1.3bn has been committed since 2023. Most of it goes to flexible generation.
The two big German gas plant projects, Scholven and Staudinger, each about 860–870 MW, will only go ahead if the coming government tenders pay enough; Uniper has ruled out building plants that rely only on market prices. It has also secured about 700 MW of grid connection capacity for three advanced data centre projects and wants to develop the land and connections, not run data centres itself.
The gas business is being rebuilt. Uniper targets 200–250 TWh of supply and sales in the medium term, against about 155 TWh in 2025, through new long-term and LNG contracts, with up to 20% exposure to US Henry Hub prices. That gives it the chance to move cargoes between markets but also brings back some of the price risk that nearly broke the company in 2022. The German state still owns almost all of Uniper and must reduce its stake under the EU conditions of the rescue. A plan centred on a growing dividend and more contracted earnings is exactly what a future sale of shares needs.
ACS (ACS Spain): Doubling profit by 2030 and paying out more
● POSITIVE
Plan to double profit by 2030, resting on Turner and data centres.
Price 90.45 · P/E next yr 21.5x · Upside 37.6%
ACS used its capital markets day to set targets that would roughly double the size of the group's earnings in four years. Revenue should reach €84–86bn in 2030, against about €56bn expected this year, and operating net profit €2.2–2.4bn, against €1.16bn. That is annual growth of about 11% in revenue and 17–20% in profit, which means the margin should widen as well. The dividend should more than double, from €2.4 to €4.9 per share, an annual increase of about 20%. ACS expects €9–11bn of operating cash flow over the four years to pay for it.
Data centres remain the largest single theme. ACS targets €27–30bn of digital infrastructure revenue by 2030, against €17–18bn this year, which implies growth of 11–14% a year, slower than the rest of the group's ambition. The company says this is based on a cautious scenario for global data centre construction, and that its backlog and high-probability projects cover more than 90% of the expected revenue for 2027 and 2028. Turner, which builds most of these projects in the US, should raise its pre-tax margin from about 4% to 5%. ACS is also developing its own sites, with 1.3 GW of capacity planned to be operational in 2027 and a first 50 MW site in Alcalá de Henares near Madrid.
The new parts of the plan are in nuclear and defence. ACS has created ACS Nuclear, a UK-based platform that brings together around 140 nuclear projects in construction, maintenance and decommissioning, and plans to raise its nuclear backlog from €2.5bn to €8–9bn by 2030, including small modular reactors. The defence backlog is already about €5bn. These markets are smaller than data centres, but they diversify the group away from a single customer type, which is the main criticism of ACS at the moment.
Capital allocation is balanced: €2.8bn of net investment in data centres, €1bn each for acquisitions and for Abertis and managed toll roads, and some optional room. CEO Juan Santamaría called infrastructure "the new gold". The plan's credibility rests on Turner and on the data centre cycle. With the stock market increasingly nervous about the financing of AI investment, ACS's diversification into nuclear, energy and defence is well timed, but it will be several years before those businesses can replace a slowdown in data centres.
Mister Spex (MRX Germany): The new model is ready, but the cash is getting thinner
● VERY NEGATIVE
Cost base is lower, but customers are falling and cash is thin.
Price 0.90 · Upside 202.8%
Mister Spex has finished rebuilding its operating model, and the cost of doing so is now visible in the cash. Revenue fell 4% to €45.7m in the third quarter and 8% to €133.6m over nine months. Online, still 60% of sales, dropped 16% over nine months, with prescription glasses down 19%, though the decline narrowed to 8% in the third quarter. The stores grew 8% over nine months and 4% in the quarter, helped by new openings in Berlin and Hamburg and six acquired independent opticians, taking the network to 66. The stores are not all equal: management said 47 of them make a positive contribution and 24 earn a margin above 10%, so there is room to improve the network by closing or fixing the weakest ones.
Profitability is improving. Adjusted EBITDA reached €5.7m over nine months, against €4.5m a year earlier, a margin of about 4.3%, and the online business earned €5.2m against €1.6m, after deep cuts in personnel and other costs. The asset-light model is now running: Arvato handles warehousing, shipping and returns, Rodenstock makes the prescription glasses, and the Berlin-Spandau logistics site is closing earlier than planned. Salesforce is being rolled out to marketing and customer service ahead of schedule, with the Swedish webshop the first to move at the end of the year.
The subscription offer, Switch, is the most promising new part. It made up about 16% of offline revenue in the third quarter, the average order is 2.2 times that of a normal purchase, and 42% of subscribers are new customers. But subscriptions are paid over time, so the revenue arrives before the cash. That shows in the guidance. Mister Spex cut its year-end cash target to €21–23m from €25–30m, partly because it accelerated the restructuring and partly because operations generated less cash. Revenue for the year is expected at the weaker end of its range of flat to down 10%.
CEO Tobias Krauss says the company has "laid the foundations for a scalable operating model", and the cost base is clearly lower. What it lacks is customers. Active customers fell 16% to 1.01m over the past twelve months, and the company has not yet said what savings the new model delivers or at what revenue it breaks even. More restructuring costs will follow in 2027. With a little over €20m of cash, Mister Spex has little room for another year of shrinking sales.
Securitas (SECU B Sweden): The targets are clear, the delivery is not yet
● NEUTRAL
Clear EPS targets, but retention and cash flow lag them.
Price 164.10 · P/E next yr 12.9x · Upside 3.2%
Securitas set new targets in June that move the focus from the operating margin to earnings growth: 10% average annual EPS growth over the cycle, operating cash flow of 80–90% of operating income, net debt below 2.5x EBITDA and a payout ratio of 50–60%. The third quarter shows how far the company still has to go. Organic growth was zero, or 3% after adjusting for the closure of the US government business, and EPS before one-off items fell to SEK 3.28 from SEK 3.34. The adjusted operating margin was 8.2%, slightly below last year's 8.3%.
The weak spot was European airports. They account for only about 5% of revenue but took 0.2 points off the group margin in the quarter. In Germany Securitas faced a high comparison base and weaker Middle East traffic in its most important quarter, and switched some contracts from per-passenger to per-hour pricing. In the Netherlands a new contract is taking longer than planned to reach its expected margin because of staffing problems. Management expects a clear improvement from 2027.
The more important trend is in technology. Technology & Solutions grew 6% in the quarter and now makes up 35% of sales, with an EBITA margin of 11.7%, well above the group's. Order intake reached record levels in North America and Ibero-America, and installations are usually billed three to six months later, so the fourth quarter and the start of 2027 should benefit. North America already shows the effect, with a margin of 9.7% against 9.5% a year earlier.
Acquisitions play a small part in the plan, about 1 point of the 10% EPS growth together with debt reduction. Securitas wants bolt-ons in technology, not guarding, that add to earnings per share within one or two years and earn a return on capital of about 15–16%, in line with its own. It will wait for the integration of Liferaft before buying more in security risk management.
Two numbers deserve attention. Client retention fell to 89% in North America from 91%, and the new CFO has called retention one of the keys to the growth target. Cash flow was 71% of operating income over nine months, below the new 80–90% target. Securitas plans to raise retention by selling more services to each client, most of whom still buy only one. That is the right strategy, but until retention and cash flow improve, the 10% EPS target is a promise, not a trend.
MBB (MBB Germany): One holding is carrying the group
● POSITIVE
Margin upgrade driven almost entirely by Friedrich Vorwerk.
Price 200 · P/E next yr 12.8x · Upside 9.3%
MBB has raised its margin guidance for the second time this year, to an adjusted EBITDA margin of 22–24%, and the reason has one name: Friedrich Vorwerk. The pipeline and energy infrastructure builder grew nine-month revenue 12.0% to €565.6m, while adjusted EBITDA rose 64% to €173.4m, a margin of 30.7%. In the third quarter alone it earned €80.9m on record revenue of €228.3m. Joint ventures, a lower material cost ratio and more in-house work did the rest. Vorwerk accounts for about 86% of the segments' combined adjusted EBITDA.
The other holdings are struggling. Aumann, which builds production lines for electric motors, saw revenue fall 33.8% to €104.4m, and its orders and backlog are well below last year as carmakers keep cutting investment. It lowered its revenue guidance to €140–160m but raised its margin target to 8–10%. DTS, the IT security business, lost a quarter of its revenue because of the Iran conflict and delays in semiconductor projects, though its margin improved to 17.8%. Delignit grew but earns little. The group's nine-month revenue fell 1.0% to €854.1m while adjusted EBITDA rose 40% to €201.1m, which shows how much depends on one company. Adjusted earnings per share rose 16.0% to €7.39.
Vorwerk's own guidance implies a slower end of the year. It raised its 2026 EBITDA target to €220–230m, which after €173.4m in nine months leaves €47–57m for the fourth quarter, well below the third quarter's €80.9m. Its backlog was €907.2m at the end of September, 18% lower than a year earlier, and €1.25bn including joint ventures, down 19%. Order intake was slightly higher than last year, so this is not a collapse, but the exceptional margins of 2026 rest partly on projects that are now being completed.
The balance sheet gives MBB plenty of options. Group net cash was €793.4m, of which €454.7m sits at the holding company itself. MBB spent €23.2m on its own shares, and Aumann bought back €23.0m of its shares through a public offer and now holds 10% of its own capital, which reduced MBB's stake to 34.15%. The holding is in a comfortable position, but it is less diversified than it looks. Its value today depends mainly on how long Germany keeps investing heavily in gas, hydrogen and electricity grids, and on what MBB eventually does with its cash.
CTS Eventim (EVD Germany): The Olympics are filling a gap in ticketing
● NEUTRAL
Olympics lift ticketing revenue while live entertainment faces tough comparisons.
Price 61.20 · P/E next yr 18.5x · Upside 37.3%
CTS Eventim's third quarter looked weaker than it was in Live Entertainment, and stronger than it was in Ticketing. Group revenue fell 5% to €809m, because Live Entertainment dropped 12% to €586m with fewer major tours than in an exceptional 2025. Over nine months revenue still rose more than 8% to over €2.3bn, and Live grew nearly 6% to €1.65bn, so the quarter is a matter of timing. Adjusted EBITDA was €134m, and the margin improved by 50bp to 16.5%.
Ticketing, the more valuable business, deserves a closer look. Revenue grew 12% to €235m, but the second ticket release for the Los Angeles 2028 Olympics contributed revenue in the mid-€20m range. Without it, ticketing revenue was roughly flat on last year's €210m. The company says like-for-like growth was about 4% in the quarter, which means the smaller contract with Stage Entertainment, a high-margin client, took several points of growth away. The ticketing margin fell 360bp to 39.5%. The Olympic tickets earn a lower margin, and the efficiency program costs about €5m a quarter. Excluding those costs, management puts the ticketing margin at about 40% over nine months.
The venues are the part that is moving. The new Unipol Dome in Milan cost a few million euros of EBITDA in the quarter while it ramped up, but its fourth-quarter calendar is full, including an 11-concert residency by Max Pezzali. At maturity, management expects high double-digit millions of revenue at a margin above 40%, and 2027 should already come close. Core live margins outside venues improved to 4% from 2.8%, and Live Entertainment earned €94m of adjusted EBITDA in the second and third quarters together, against €80m a year earlier. Over nine months, earnings per share rose 14% to €1.78.
The full-year outlook of slightly higher revenue and EBITDA stands, and CTS adjusted €7.2m of refunds for a promoter in difficulty out of EBITDA. Management said the lower ticketing margin does not mean a structural change in the business, and the mix effects from the Olympics and Stage explain most of it. The capital markets day in Milan this week is the moment for the company to explain how much it plans to invest in venues and what returns it expects. Those answers count, because underlying ticketing growth is slower than the headline, and the case for the shares increasingly rests on owning the arenas as well as selling the tickets.
IDI (IDIP France): NAV is growing faster than last year
● POSITIVE
NAV growth accelerates and €234m of firepower is ready.
Price 68.20 · P/E next yr 8.2x · Upside 14.4%
IDI's net asset value reached €101.54 per share at the end of September, 7.8% more than the €94.20 at the end of 2025 after the dividend. A year earlier the same period produced growth of only 2.1%. Total NAV is €772m. Only listed holdings and liquid assets are revalued in the third quarter, so most of this year's growth was already in the first half, when net income almost quadrupled to €57.1m on disposals and higher valuations.
The portfolio is turning over at a good pace. IDI sold its entire stake in Winncare, a care equipment business it first invested in in 2014 and backed again in 2021. Together with Groupe Chevrillon and Fiblac, it agreed to sell legal protection insurer CFDP to AG2R La Mondiale, a deal that awaits approval from the ACPR and should close by year-end. The portfolio companies also kept buying: S4BT, which provides business travel solutions, acquired the parent of HotelHub, and Groupe PLC bought Floralpina. IDI did not disclose sale prices, which is typical for the company. Cash and liquid assets stood at €198.0m at the end of June, and consolidated equity at €774.5m. The result from investment activities in the first half was €66.7m, more than twice the €28.1m of a year earlier.
The firepower is substantial. Investment capacity reached €234m at the end of September, up from €178m a year earlier and equal to about 30% of NAV, made up of cash and liquid assets at IDI and Financière Bagatelle and €35m of undrawn credit lines. That is a lot of money for a group of this size, and in today's private equity market, where many funds struggle to raise money, a well-funded buyer can negotiate good prices. The long record is the best argument for IDI. Over the ten years to June 2026, NAV per share rose from €34.53 to €101.90, about 11.4% a year, and shareholders received €32.5 per share of dividends on top. The shares have historically traded well below NAV, and they still do, so investors buy that record at a discount. The risk is cash drag: with almost a third of NAV not yet invested, returns depend on IDI finding new deals at sensible prices.
Jost (JST Germany): The Americas are carrying the margin
● POSITIVE
Guidance raised as the Americas carry the margin.
Price 58.60 · P/E next yr 9.8x · Upside 32.1%
Jost raised its full-year guidance on 5 November and confirmed it with the full third-quarter report. Sales rose 11.3% to €426.3m, with organic growth of 8.9%, and adjusted EBIT increased 11.8% to €41.6m, a margin of 9.8%. All three business lines grew. Transport, the largest, rose 14.3% thanks to strong US truck production, Agriculture 12.6% and Hydraulics 5.7%, the slowest after Jost streamlined the Hyva portfolio. For the year, Jost now expects sales growth of 9–11% and adjusted EBIT growth of 11–14%, which on last year's base means sales of about €1.67–1.70bn and EBIT of €161–166m.
The regional figures are more uneven. The Americas grew sales 19.3% and adjusted EBIT 68.4% to €18.4m, a margin of 14.5% against 10.3% a year earlier. APAC grew 18.9% at a margin of 13.2%, slightly lower because of mix and freight and customs costs on imports from China. EMEA is the weak spot. Sales rose only 2.5%, and adjusted EBIT fell to €7.1m from €11.4m, a margin of 3.8%, hit by freight and input costs, a site closure and start-up costs for a relocation. EMEA makes up 44% of sales but less than a fifth of segment profit.
Cash flow was weak in the quarter. Free cash flow fell to €7.3m from €57.4m because working capital rose to 18.7% of sales, slightly above the 17.5–18.5% target range. The balance sheet still improved: leverage came down to 1.78x from 2.27x at the end of 2025, back within the 1.0–2.0x target, and ROCE rose 2.5 points to 16.5%. The gross margin rose 0.7 points to 28.1%, although adjusted earnings per share were flat at €1.24 because of higher financing and tax costs. Synergies from Hyva supported the gross margin, and cross-selling between Jost and Hyva is now a source of growth.
Jost keeps adjusting its portfolio. It is selling Hyva's Indian tipper body business, with €30–40m of revenue and only about €1m of EBITDA, for about €5m, and after the quarter it bought the remaining 25% of Brazilian Usimeca. Both moves make sense. Management expects the US truck market to accelerate further in the fourth quarter and says it approaches 2027 with confidence, even after the Indian sale. The task for 2027 is EMEA: if Jost can bring the European margin back towards its old level while the US truck cycle holds, the group margin can move well above 10%.
Strabag (STR Austria): The overhang is about to move
● POSITIVE
Court ruling could soon unlock the frozen Rasperia stake.
Price 107.20 · P/E next yr 13.4x · Upside 20.8%
Strabag's nine-month trading statement, with the second margin upgrade in three months, was covered here last week, and the full release adds a few details. Output rose 14% to €16.49bn over nine months, with North + West up 21%, International + Special Divisions 15% and South + East 6%. The backlog of €34.97bn is 12% higher than a year earlier, and International + Special Divisions now has €11.9bn, up 31%, after mining contracts in Chile and rail work in Australia. After the quarter Strabag was confirmed as preferred bidder for the D35 motorway PPP in the Czech Republic, worth about €2.9bn over the concession.
The guidance arithmetic is worth doing. Output of close to €23bn means about €6.5bn in the fourth quarter. With a 6–6.5% EBIT margin, full-year EBIT would be about €1.38–1.50bn. In the first half Strabag earned only €174m, so the second half has to deliver €1.2–1.3bn. That is normal for a construction group whose profits come when projects are completed and invoiced at year-end, but it means the whole year rests on the fourth quarter.
The more important news is about the shareholder base. Raiffeisen Bank International won its case against Rasperia Trading, the vehicle linked to Oleg Deripaska that holds 28.5m Strabag shares, roughly a quarter of the company. The court ordered Rasperia to pay about €3.15bn in damages, and the ruling is final. RBI has asked the Austrian Financial Market Authority to release the frozen shares and the nearly €500m of dividends attached to them so it can enforce its claim, and it plans to sell the shares. The process could take up to six months. A sale of that size could weigh on the shares in the short term, but it would also remove a sanctioned shareholder and add substantially to a small free float, one reason Strabag has traded below its peers.
Allgeier (AEIN Germany): A smaller company with a demanding fourth quarter
● NEGATIVE
Generous payouts raise debt while Q4 has to carry the year.
Price 13.50 · P/E next yr 27.1x · Upside 38.0%
Allgeier is now a much smaller company than a year ago, with about 2,400 employees at 47 locations, mostly in software development and IT services for public and enterprise clients. It sold its managed services business at the end of 2025 and Allgeier Engineering in the first half of this year, and publicplan is up for sale. What remains grew revenue 6% to €82m in the third quarter and adjusted EBITDA 8% to €14.1m, a margin of 16.6%. Over nine months the continuing business grew revenue 9% to €244m and adjusted EBITDA 7% to €31.6m. Reported EBITDA fell 4% to €11.7m in the quarter because of €2.4m of one-off costs, mostly for job cuts, which should lower the cost base from next quarter. Value added, revenue minus external costs, rose to €34m, a stable 40% margin, so the growth did not come from lower-quality work.
The guidance for the continuing business was confirmed: revenue of €335–375m and adjusted EBITDA of €46–52m. After nine months that leaves a lot for the last quarter. Even the bottom of the revenue range requires €91m, 11% more than the third quarter, and the EBITDA range implies €14.4–20.4m. The lower end is roughly a repeat of the third quarter, the midpoint a 23% increase. The nine-month margin of about 13.0% is also at the bottom of the 13.0–13.5% target. The year-end is seasonally strong for IT services, but the lower half of the range looks more realistic.
The balance sheet has become heavier. Net debt including factoring rose to €83m at the end of September from €54m at the end of 2025, and cash fell from €42m to €23m. The main reasons were shareholder payouts: a dividend of €11m in July, almost twice last year's, and €8.5m of share buybacks in the first half, about €20m in total. Equity dropped to €180m from €205m. Allgeier is paying out generously while its earnings base shrinks and changes shape, which makes the business hard to follow from the outside. Each disposal changes the comparison, and the consensus figures barely reflect the new structure. The strategy of focusing on software development and IT services for public and enterprise clients is sensible, but investors need a few clean quarters on a stable portfolio before they can judge what this business earns.